25 July 2018
2018- n° 194In July 2018, developers' opinion on demand for new dwellings deteriorates slightly Quaterly business survey in the real-estate development - July 2018
25 July 2018
2018- n° 194In July 2018, developers' opinion on demand for new dwellings deteriorates slightly Quaterly business survey in the real-estate development - July 2018
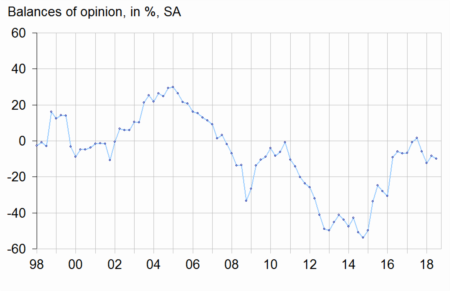
In July 2018, slightly fewer developers than in April deem that the demand for new dwellings is high. The corresponding balance has weakened slightly and has moved just below its long-term average.
In July 2018, slightly fewer developers than in April deem that the demand for new dwellings is high. The corresponding balance has weakened slightly and has moved just below its long-term average.
Prospects for housing starts lighten
In July 2018, the outlook for housing starts for the next three months has improved. The corresponding balance has increased again and has exceeded its long-term average. In detail, the balance on housing starts for sale has bounced back and has returned above its average. That on housing starts for rent has increased sharply again and has gone above its long-term average. At the same time, more developers than in April 2018 have indicated an increase in unsold dwelling stocks. The corresponding balance has recovered and has exceeded its long-term average.
Fewer developers indicate an increase in average new housing price
Fewer developers than in April have indicated a rise in the average price of new dwellings for sale; the corresponding balance of opinion has decreased but remains well above its long-term average. About funding, fewer developers than in April consider that downpayment to acquire a new dwelling has increased during the last few months, the balance remaining above its long-term average. Finally, as many developers as in April think that the financing capacity to purchase new housing will increase over the next quarter; the balance also remains above its long-term average.
tableauTable1 – Real-estate development economic outlook
| Mean* | Oct. 17 | Jan. 18 | April 18 | July 18 | |
|---|---|---|---|---|---|
| New dwelling demand | –9 | –6 | –12 | –8 | –10 |
| Expected housing starts | –7 | –4 | –11 | –10 | –4 |
| - for sale | –15 | –5 | –12 | –16 | –11 |
| - for rent | 0 | –2 | –8 | 0 | 13 |
| Unsold dwelling stock tendency | –26 | –25 | –21 | –29 | –25 |
| Housing average price for sale | 4 | 9 | 15 | 15 | 10 |
| Downpayment | –20 | –14 | –11 | –12 | –16 |
| Financing capacity | –21 | –12 | –17 | –16 | –16 |
- * Mean since July 1991.
- Source: French business survey on real-estate development - INSEE
graphiqueGraph1 – New dwelling demand tendency