

 24 July 2018
2018- n° 192In July 2018, industrialists are again less optimistic about the outlook for demand
and export Quarterly business survey (goods-producing industries) - July 2018
24 July 2018
2018- n° 192In July 2018, industrialists are again less optimistic about the outlook for demand
and export Quarterly business survey (goods-producing industries) - July 2018
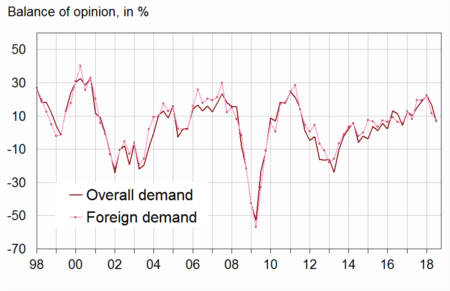
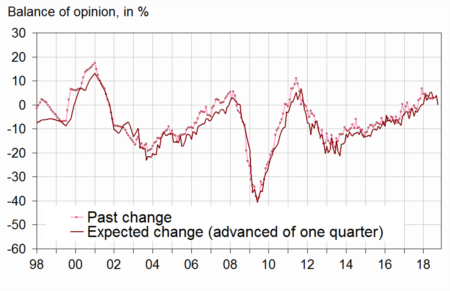
The balances of industrialists' opinion on overall and foreign demand in the last three months have dropped again sharply in July – they had reached at the beginning of the year their highest level in seven years, before dropping back in the April survey. Business managers are also less optimistic about overall and foreign demand over the next three months; the corresponding balances have slipped back again after peaking early 2018 at their highest level since 2000. However the four balances remain higher than their long-term average.
Demand has been assessed less favourably again
The balances of industrialists' opinion on overall and foreign demand in the last three months have dropped again sharply in July – they had reached at the beginning of the year their highest level in seven years, before dropping back in the April survey. Business managers are also less optimistic about overall and foreign demand over the next three months; the corresponding balances have slipped back again after peaking early 2018 at their highest level since 2000. However the four balances remain higher than their long-term average.
graphiqueGraph 1 – Balance of opinion of past change in demand
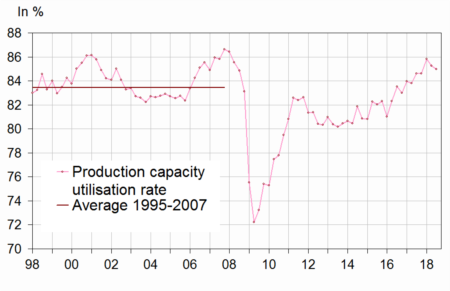
Slightly less pressure on production equipment than at the beginning of the year
In July 2018, industrialists report that they have slightly reduced the use of their machinery and equipment. The production capacity utilisation rate stands at 85.0%, down by 0.2 points compared to April 2018. It had reached in January its highest level in ten years.
However, slightly more industrialists consider that they could not produce more if they received more orders: production bottlenecks have tightened slightly, without however reaching their peak of January 2018. The proportion of industrialists indicating difficulties of supply exclusively has slightly edged back down in July, after peaking in October 2017 at its highest level since April 2001. That of industrialists reporting difficulties of demand exclusively has also slightly decreased.
graphiqueGraph 2 – Production capacity utilisation rate
tableauTable 1 – Industrialists' opinion: demand and production factors
| Manufacturing industry | Mean | Oct. 17 | Jan. 18 | April 18 | July 18 |
|---|---|---|---|---|---|
| Overall demand | |||||
| Past change | 0 | 19 | 22 | 17 | 6 |
| Future change | 2 | 18 | 18 | 12 | 8 |
| Foreign demand | |||||
| Past change | 2 | 19 | 22 | 12 | 7 |
| Future change | 4 | 23 | 18 | 12 | 10 |
| Production factors | |||||
| Production bottlenecks (in %) | 22 | 32 | 36 | 31 | 33 |
| Assessment of productive capacity | 14 | –2 | –3 | –4 | –3 |
| Production capacity utilisation rate (in %) | 83,0 | 84,6 | 85,8 | 85,2 | 85,0 |
| Difficulties of supply and demand (in %) | |||||
| Difficulties of supply and demand | 8 | 9 | 9 | 8 | 9 |
| Difficulties of supply only | 20 | 33 | 30 | 30 | 29 |
| Difficulties of demand only | 43 | 27 | 25 | 27 | 26 |
- * : Long-term average since 1976, except for questions on difficulties of supply and demand.
- The results of the last survey are preliminary.
- Source: INSEE - Quarterly business survey in industry
The balances of opinion on workforce size trends have decreased but remain well above their average
In July 2018, again slightly fewer industrialists have reported an increase in their workforce size rather than a decrease in the last three months. Also fewer have forecast job growth rather than job cuts over the next three months. After reaching their highest level since July 2011, both corresponding balances remain significantly above their long-term average.
The share of industrialists experiencing hiring difficulties, already at a high level, has slightly increased – 44% in July 2018 against 27% in early 2017.
graphiqueGraph 3 – Workforce size in the manufacturing industry
Slight increase in selling prices
According to industrialists, selling prices in the manufacturing industry have continued to increase, at a slightly higher pace than in Q1 2018 (+0.5% after +0.3%). Business managers forecast a small increase in Q3 2018 (+0.1%).
Only 10% of the industrialists have experienced cash-flow problems, a level virtually stable since April 2017, below its long-term mean (14%).
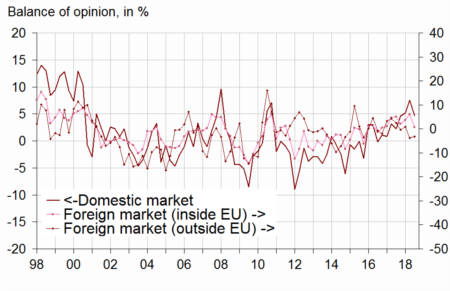
General export prospects have deteriorated
Industrialists are again less upbeat on general export prospects: after reaching in January its highest level since October 2000, the corresponding balance of opinion has drastically fallen back in April and again in July. It remains however above its long-term average. Industrialists' opinion on their competitive position has weakened regarding the domestic and EU markets. However, it has slightly improved regarding the market outside the EU.
graphiqueGraph 4 – Competitive position
tableauTable 2 – Industrialists' opinion: employment, competitive position, cash-flow and selling prices
| Manufacturing industry | Mean | Oct. 17 | Jan. 18 | April 18 | July 18 |
|---|---|---|---|---|---|
| Workforce size | |||||
| Past change | –11 | 2 | 5 | 4 | 3 |
| Expected change | –13 | 0 | 3 | 3 | 0 |
| Difficulties hiring (in %) | 29 | 42 | 41 | 42 | 44 |
| Selling prices and cash-flow | |||||
| Past change on selling prices | 0,1 | 0,7 | 0,8 | 0,3 | 0,5 |
| Expected change on selling prices | 0,2 | 0,2 | 0,3 | 0,1 | 0,1 |
| Cash-flow problems (in %) | 14 | 10 | 10 | 10 | 10 |
| Competitive position | |||||
| On domestic market | 1 | 5 | 5 | 8 | 5 |
| On foreign markets inside EU | –1 | 2 | 4 | 6 | 1 |
| On foreign markets outside EU | –2 | 0 | 1 | –4 | –3 |
| General exportation expectations | –8 | 19 | 22 | 15 | 4 |
- * : Long-term average since 1976, except for workforce change (since 1976) and for competitive position by market (since 1997).
- The results of the last survey are preliminary.
- A quantitative question is asked about selling prices.
- Source: INSEE - Quarterly business survey in industry
Documentation
Abbreviated methodology (pdf,174 Ko)
Pour en savoir plus
Time series : Industry