

 31 May 2018
2018- n° 143In Q1 2018, producer prices for services sold to French businesses decreased slightly
(−0,2 %) Services producer price indices - first quarter 2018
31 May 2018
2018- n° 143In Q1 2018, producer prices for services sold to French businesses decreased slightly
(−0,2 %) Services producer price indices - first quarter 2018
In the first quarter of 2018, producer prices of services sold to French businesses went down slightly (−0.2% after +0.7%). Year over year, they increased by 0.8% as in the previous quarter.
- SPPI, production sold to French businesses
- Seasonal declines in prices of some services
- Backdrop in prices for real estate activities
- Rises in prices for transport and storage services and for administrative and support services
- SPPI, production sold to households in France
- SPPI, production sold on foreign markets
- SPPI (all markets)

Information: in accordance with the European directives, services producer price indices are broadcast in reference 100 in 2015 from this release. Additional information related to this change are available on the Web page of these indicators (flag: Documentation).
SPPI, production sold to French businesses
In the first quarter of 2018, producer prices of services sold to French businesses went down slightly (−0.2% after +0.7%). Year over year, they increased by 0.8% as in the previous quarter.
Seasonal declines in prices of some services
Prices for scientific and technical services fell (−0.7% after +0.7%), mainly due to the downturn in prices for media representation after the sharp seasonal rebound in the fourth quarter 2017 (−10.1% after +15.7%). Prices for information-communication services also fell back (−0.6% after +1.1%), driven by those of programming and broadcasting activities (−9.0% after +10.5%).
Prices for accomodation-food services also went down seasonally (−0.4% after +1.7%), due to the decline in prices for hotel and similar accommodation services aimed to professionals (−3.4%).
Backdrop in prices for real estate activities
Prices for real estate activities also dwindled (−0.9% after +1.2%), due to renting and operating services of own or leased real estate.
Rises in prices for transport and storage services and for administrative and support services
Prices for transport and storage services went up by 0.6%, mainly thanks to the seasonal rise in prices of postal and courier services (+4.1%). Prices for storage and for support activities for transportation and those for land and pipeline transport also grew modestly.
Prices for administrative and support services gathered pace (+0.5% after +0.1%) thanks to the increase in those of administrative services and other support services to businesses.
SPPI, production sold to households in France
In the first quarter 2018, producer prices of services sold to households in France bounced back slightly (+0.3% after −1.7%), thanks to real estate activities (+0.6%) and accomodation-food services (+0.4%).
SPPI, production sold on foreign markets
Export prices were virtually stable in the first quarter 2018 (−0.1% after −0.3%). The drop in prices for transport and storage services (−0.6%) and for scientific and technical services (−0.5%) was almost offset by the rise in prices for administrative and support services (+0.6%).
SPPI (all markets)
In the first quarter of 2018, on all markets, producer prices of services were stable for the second quarter in a row. Year over year, they increased by 0.7%, as in the previous quarter.
graphiqueGraphique1 – Producer price indices for all services
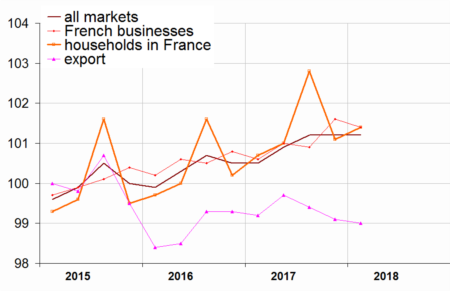
- Reference year: 2015
- Source: INSEE
graphiqueGraphique2 – Producer price indices of services sold to French businesses
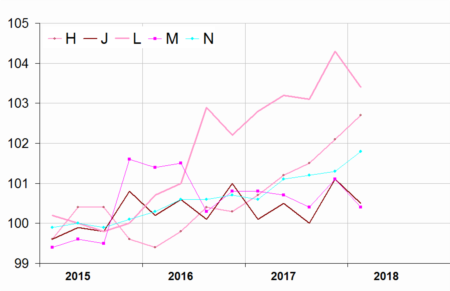
- Reference year: 2015
- Source: INSEE
graphiqueGraphique3 – Services producer price indices, all markets
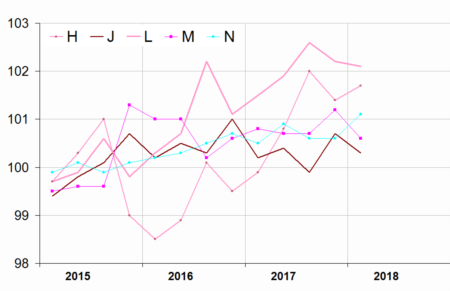
- Reference year: 2015
- Source: INSEE
tableauTableau1 – Services producer price indices, by sector
| Sections and choices of | Weight | Indices | Change in % | |
|---|---|---|---|---|
| levels in NAF rev.2 | 2018Q01 | Q/Q-1 | Q/Q-4 | |
| Prices of services sold to French businesses (BtoB) | ||||
| HN : all services | 1000 | 101.4 | –0.2 | 0.8 |
| H : transport. and storage | 180 | 102.7 | 0.6 | 2.0 |
| 49 : land and pipeline transport | 81 | 101.7 | 0.5 | 0.9 |
| 52 : warehousing and auxiliary services for transport | 73 | 103.5 | 0.5 | 3.0 |
| I : accommodation and food | 44 | 99.3 | –0.4 | 1.6 |
| J : information and communic. | 237 | 100.5 | –0.6 | 0.4 |
| 62 : IT services | 92 | 100.2 | –0.1 | 0.0 |
| L : real estate activities | 103 | 103.4 | –0.9 | 0.6 |
| M : prof., scient. and tech. | 218 | 100.4 | –0.7 | –0.4 |
| 69 : Legal and accounting services | 46 | 98.0 | –0.3 | –0.8 |
| 70 : activities of head offices and management consulting services | 47 | 100.2 | 0.7 | 0.4 |
| 71 : Architectural and engineering services | 83 | 101.4 | –0.7 | –0.4 |
| 73 : Advertising and market research services | 26 | 100.7 | –3.5 | –0.9 |
| N : administ. and support serv. | 210 | 101.8 | 0.5 | 1.2 |
| 77 : renting & leasing services | 60 | 99.6 | 0.2 | 0.2 |
| 78 : employment services | 52 | 101.8 | 0.1 | 1.3 |
| 82 : Office administrative and support services | 46 | 103.3 | 0.7 | 2.3 |
| Prices of services sold to households in France (BtoC) | ||||
| HN : all services | 1000 | 101.4 | 0.3 | 0.7 |
| H : transport. and storage | 153 | 100.9 | 0.0 | 1.0 |
| I : accommodation and food | 255 | 102.6 | 0.4 | 1.0 |
| J : information and communic. | 179 | 100.7 | –0.1 | –0.3 |
| L : real estate activities | 284 | 100.9 | 0.6 | 0.6 |
| M : prof., scient. and tech. | 73 | 103.4 | 0.2 | 2.6 |
| N : administ. and support serv. | 42 | 97.5 | 0.3 | –1.4 |
| Export prices of services (BtoE) | ||||
| HN : all services | 1000 | 99.0 | –0.1 | –0.2 |
| H : transport. and storage | 313 | 99.0 | –0.6 | 2.1 |
| J : information and communic. | 148 | 97.6 | –0.1 | –2.0 |
| M : prof., scient. and tech. | 215 | 99.5 | –0.5 | –0.8 |
| N : administ. and support serv. | 314 | 99.7 | 0.6 | –1.0 |
| Prices of services sold on all markets (BtoAll) | ||||
| HN : all services | 1000 | 101.2 | 0.0 | 0.7 |
| H : transport. and storage | 189 | 101.7 | 0.3 | 1.8 |
| I : accommodation and food | 92 | 101.5 | 0.1 | 1.2 |
| J : information and communic. | 212 | 100.3 | –0.4 | 0.1 |
| L : real estate activities | 136 | 102.1 | –0.1 | 0.6 |
| M : scient. and tech. services | 181 | 100.6 | –0.6 | –0.2 |
| N : administ. and support serv. | 180 | 101.1 | 0.5 | 0.6 |
- s: statistical confidentiality
- BtoB: business to business
- BtoC: business to consumer
- BtoE: business to exports
- BtoAll: business to all
- Source: INSEE
Pour en savoir plus
Time series: Services producer price indices