

 29 May 2018
2018- n° 137May 2018: households' confidence has been stable for four months (100) Monthly consumer confidence survey - May 2018
29 May 2018
2018- n° 137May 2018: households' confidence has been stable for four months (100) Monthly consumer confidence survey - May 2018
In May 2018, households' confidence in the economic situation was unchanged again. Since February, the synthetic index has been at 100, its long term average.
In May 2018, households' confidence in the economic situation was unchanged again. Since February, the synthetic index has been at 100, its long term average.
graphiqueGraph1 – Consumer confidence synthetic index
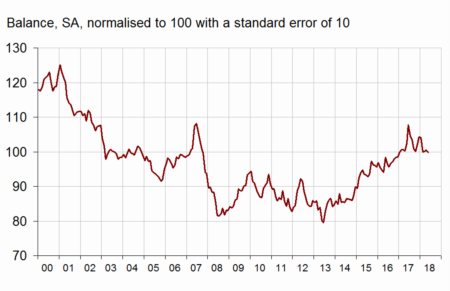
- Source: INSEE
Personal situation
Personal financial situation: virtually stable
In May, households' balances of opinion on their past and expected personal situation were virtually stable: the former gained one point and the latter lost one. Both balances stand below their long term average.
The share of households considering it is a suitable time to make major purchases decreased slightly in May (−2 points), thus returning to its level of March. Nevertheless, the corresponding balance stays clearly above its long term average.
Expected saving capacity: clear improvement
In May, households' balance of opinion on their expected saving capacity improved clearly: it gained 6 points and now stands above its long terme average. The balance on their current saving capacity was virtually stable (+1 point) and stays slightly above its long term average.
The share of households considering it a suitable time to save increased noticeably in May (+5 points). However, the corresponding balance stays clearly below its long term average.
graphiqueGraph2 – Balances on personal financial situation and standard of living in France
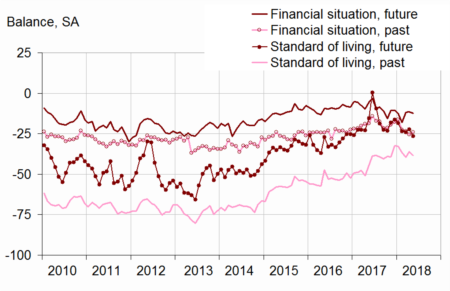
- Source: INSEE
Economic situation in France
Standard of living in France: worsening
In May, households were less optimistic on their future standard of living in France: the corresponding balance lost 4 points and reached its lowest level since October 2016. Thus, it now stands slightly below its long term average. Households were also less numerous to consider that the past standard of living in France improved during the past twelve months: the corresponding balance has lost 3 points, but remains above its long term average.
Unemployment: expected decrease
Households' opinion on the unemployment trend improved in May (−6 points). The corresponding balance remains far below its long-term average.
graphiqueGraph3 – Households' unemployment expectations
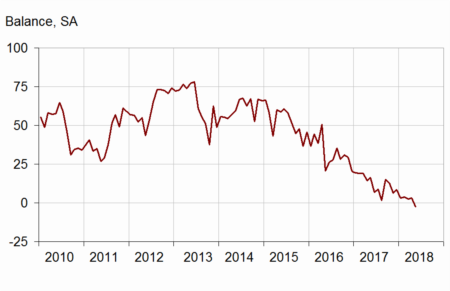
- Source: INSEE
Perceived and expected inflation: rising
In May, households were more numerous than the previous month to expect prices to increase during the next twelve months: the corresponding balance gained 7 points and stands clearly above its long term average.
Households were also more numerous that in April to consider that prices were on the rise during the last twelve months: the corresponding balance gained 7 points. However, it stands way below its long term average.
graphiqueGraph4 – Households' perception of prices
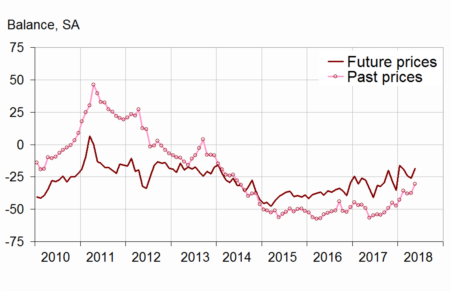
- Source: INSEE
Revision
Due to the actualisation of the seasonal adjustment coefficients, the synthetic index of April 2018 was revised downwards by one point: it now stands at 100.
tableauTable – CONSUMER OPINION: synthetic index and opinion balances
| Avg. (1) | Feb. 18 | March 18 | April 18 | May 18 | |
|---|---|---|---|---|---|
| Synthetic index (2) | 100 | 100 | 100 | 100 | 100 |
| Financial sit., past 12 m. | –21 | –22 | –23 | –25 | –24 |
| Financial sit., next 12 m. | –5 | –18 | –12 | –11 | –12 |
| Current saving capacity | 8 | 11 | 9 | 9 | 10 |
| Expected saving capacity | –9 | –8 | –7 | –9 | –3 |
| Savings intentions, next 12 m. | 17 | 5 | 5 | 4 | 9 |
| Major purchases intentions, next 12 m. | –14 | –4 | –5 | –3 | –5 |
| Standard of living, past 12 m. | –45 | –37 | –40 | –36 | –39 |
| Standard of living, next 12 m. | –25 | –24 | –24 | –22 | –26 |
| Unemployment, next 12 m. | 34 | 4 | 3 | 3 | –3 |
| Consumer prices, past 12 m. | –17 | –36 | –38 | –38 | –31 |
| Consumer prices, next 12 m. | –34 | –19 | –24 | –26 | –19 |
- (1) Average value between January 1987 and December 2017
- (2) The indicator is normalised in such a way that its average equals 100 and standard error equals 10 over the estimation period (1987-2017).
- Source: INSEE, monthly consumer confidence survey