

 24 May 2018
2018- n° 130In May 2018, the business climate is stable in manufacturing Monthly business survey (goods-producing industries) - May 2018
24 May 2018
2018- n° 130In May 2018, the business climate is stable in manufacturing Monthly business survey (goods-producing industries) - May 2018
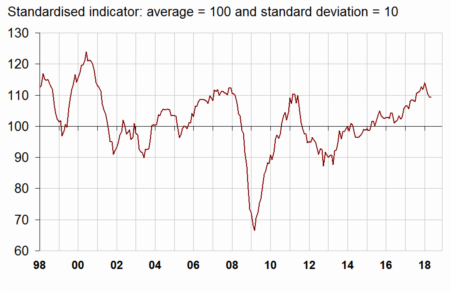
According to the business managers surveyed in May 2018, the business climate in industry remains at a high level. After deteriorating since the beginning of the year, the composite indicator is stable in May. At 109, it remains well above its long-term average (100). It had reached a seventeen-year peak in January 2018.
- Manufacturers are more upbeat about their personal production prospects, less about the general prospects for the sector
- In the agrofood industry, the business climate is stable
- The business climate has slightly improved in the manufacture of machinery and equipment goods
- The business climate in the manufacture of transport equipment is less favourable
- The business climate is stable in “other manufacturing industries”
According to the business managers surveyed in May 2018, the business climate in industry remains at a high level. After deteriorating since the beginning of the year, the composite indicator is stable in May. At 109, it remains well above its long-term average (100). It had reached a seventeen-year peak in January 2018.
graphiqueGraph 1 – Business climate in industry - Composite indicator
The turning-point indicator stands in the uncertainty area.
graphiqueGraph 2 – Turning-point indicator
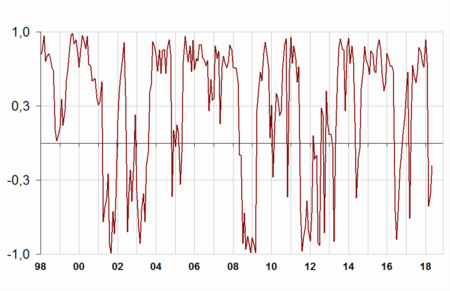
- How to read it: close to 1 (resp. -1), the indicator points to a favourable short-term economic situation (resp. unfavourable). The uncertainty area is between −0.3 and +0.3.
Manufacturers are more upbeat about their personal production prospects, less about the general prospects for the sector
The balance of industrialists' opinion on past activity is back on track after having sharply dropped in April. That on personal production expectations, already well above its average, has increased slightly further.
However, manufacturers are less optimistic about the general production prospects for the sector. Their opinion on overall books is stable, that on export order books has slightly dipped. The corresponding balances are slightly lower than in January and February when they had reached levels not seen since December 2007.
More industrialists than in April consider that their finished-goods inventories are above normal. The corresponding balance is approaching its long-term mean.
As regards employment, the balance of opinion on expected workforce size has edged up and is approaching its February and March level, its highest since June 2011. That on past workforce size has slightly dipped. Both balances remain well above their long-term average.
tableauTable 1 – Industrialists' opinion on manufacturing activity
| Manufacturing industry | Ave.* | Feb. 18 | March 18 | April 18 | May 18 |
|---|---|---|---|---|---|
| Composite indicator | 100 | 112 | 110 | 109 | 109 |
| Past activity | 5 | 19 | 17 | 7 | 10 |
| Finished-goods inventory | 13 | 5 | 5 | 5 | 10 |
| Overall order books | –18 | 2 | 1 | 1 | 1 |
| Export order books | –14 | 3 | 2 | 1 | 0 |
| Past workforce size | –10 | 5 | 4 | 4 | 2 |
| Expected workforce size | –12 | 5 | 5 | 3 | 4 |
| Personal production expectations | 5 | 15 | 9 | 15 | 17 |
| General production expectations | –8 | 30 | 26 | 23 | 15 |
- * Long-term average since 1976.
- Source: INSEE - Monthly business tendency survey in industry
In the agrofood industry, the business climate is stable
In the manufacture of food products and beverages, the business climate indicator is stable in May. At 108, it remains well above its long-term average (100). The increase in the balances on overall and export order books is offset by the decrease in those on past and future activity.
The business climate has slightly improved in the manufacture of machinery and equipment goods
In the overall manufacture of machinery and equipment goods, the business climate has increased by one point and further exceeds its long-term average. This improvement mainly comes from the increase in the balances on export order books and on personal production expectations.
The business climate has slightly improved in machinery and equipment and in electrical equipment while it has dipped in the computer, electronic and optical product industry.
The business climate in the manufacture of transport equipment is less favourable
In the manufacture of transport equipment, the business climate has weakened after reaching in April its highest level since June 2001. At 109, it still remains well above its long-term average (100). This dip comes from the decrease in the balances on overall and export order books.
The business climate indicator has declined further in the manufacture of motor vehicles, trailers and semi-trailers, more markedly than in April. It has fallen back in the manufacture of other transport equipment, back to its March level. In both sectors, the climate remains well above average.
The business climate is stable in “other manufacturing industries”
In overall “other manufacturing”, the business climate is stable at 107, well above its long-term average. The small variations in the various balances offset each other.
By subsector, the business climate indicator has edged down in rubber and plastic products. It is stable in wood-paper, chemicals and clothing-textiles. It has slightly picked up in basic metals and in the “other manufacturing industries”.
graphiqueGraph 3 – Business climates in a sector-based approach
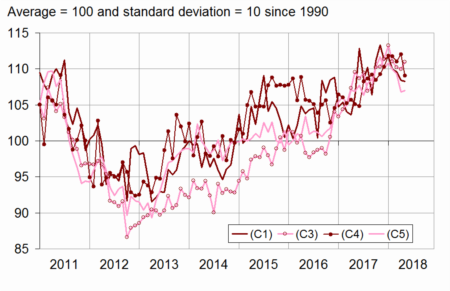
- Legend: (C1): Manufacture of food products and beverages - (C3): Machinery and equipment goods - (C4): Manufacture of transport equipment - (C5): Other manufacturing
tableauTable 2 – Business climates in a sector-based approach
| NA* : (A17) et [A38 et A64] | Weights** (%) | March 18 | April 18 | May 18 |
|---|---|---|---|---|
| (C1) Man. of food products and beverages | 22 | 110 | 108 | 108 |
| (C3) Machinery and equipment goods | 11 | 110 | 110 | 111 |
| [CI] Computer, electronic and optical products | 3 | 107 | 109 | 108 |
| [CJ] Electrical equipment | 3 | 110 | 109 | 110 |
| [CK] Machinery and equipment | 5 | 110 | 111 | 112 |
| (C4) Man. of transport equipment | 15 | 111 | 112 | 109 |
| [CL1] Motor vehicles, trailers and semi-trailers | 7 | 113 | 112 | 108 |
| [CL2] Other transport equipment | 8 | 104 | 106 | 104 |
| (C5) Other manufacturing | 46 | 109 | 107 | 107 |
| [CB] Textiles, clothing industries, leather and footwear industry | 2 | 115 | 112 | 112 |
| [CC] Wood, paper, printing | 5 | 111 | 109 | 109 |
| [CE] Chemicals and chemical products | 9 | 108 | 104 | 104 |
| [CG] Rubber and plastic products | 7 | 109 | 110 | 109 |
| [CH] Basic metals and fabricated metal products | 11 | 107 | 105 | 106 |
| [CM] Other manufacturing industries | 9 | 105 | 105 | 106 |
- * NA: aggregated classification, based on the French classification of activities NAF rév.2.
- ** Weights used to aggregate sub-sector's balances of opinion.
- Source: INSEE - Monthly business tendency survey in industry
Documentation
Methodology (pdf,133 Ko)
Pour en savoir plus
Time series : Industry - Activity and demand