

 27 April 2018
2018- n° 116In February 2018, the turnover in the manufacturing industry fell (−0.8%) Turnover in industry and construction - February 2018
27 April 2018
2018- n° 116In February 2018, the turnover in the manufacturing industry fell (−0.8%) Turnover in industry and construction - February 2018
In February 2018, the turnover fell in the manufacturing industry (−0.8%) after a stability in January. It also declined slightly in industry as a whole (−0.3%) after a virtual stability in January.
Export turnover also fell (−1.6%) after a stability in January.
- Slight increase over the last three months (+0.2%)
- Sharp increase compared to the previous year (+4.5%)
- Significant downturn in “other manufacturing” (−1.6%)
- Sharp contraction in coke and refined petroleum products (−3.7%)
- Increase in transport equipment (+0.4%)
- Virtual stability in machinery and equipment (+0.1%)
- Stability in food products and beverages
- Revisions

The commentary shows variations of subsections by decreasing contribution to the overall evolution. The contribution of a subsection depends on the extent of the change and on its weight.
In February 2018, the turnover fell in the manufacturing industry (−0.8%) after a stability in January. It also declined slightly in industry as a whole (−0.3%) after a virtual stability in January.
Export turnover also fell (−1.6%) after a stability in January.
Slight increase over the last three months (+0.2%)
The turnover increased slightly over the last three months in the manufacturing industry (+0.2%), as well as in industry as a whole (+0.3%). Within manufacturing, the turnover rose strongly in the manufacture of coke and refined petroleum products (+8.3%). It grew moderately in “other manufacturing” (+0.4%). Converserly, it declined in the manufacture of transport equipment (−2.0%) and in the manufacture of food products and beverages (−0.2%). It was vitually stable in the machinery and equipment goods.
Sharp increase compared to the previous year (+4.5%)
The turnover grew sharply compared to the same three months of the previous year in the manufacturing industry (+4.5%) and in industry as a whole (+4.5%). Over this period, the turnover rose strongly in every main sectors of the manufacturing industry − “other manufacturing” (+5.0%), the manufacture of food products and beverages (+3.1%), the manufacture of transport equipment (+3.6%), the manufacture of coke and refined petroleum products (+9.6%) and the machinery and equipment sector (+4.2%).
graphiqueGraph1 – Turnover in manufacturing industry
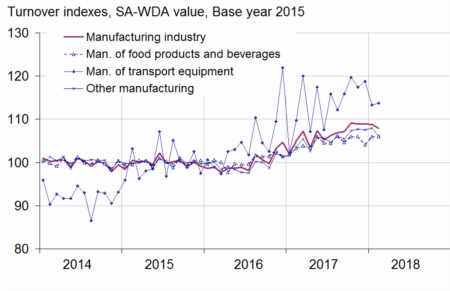
- Sources: DGFiP, INSEE
tableauTable1 – Variation of the turnover in industry and construction
| Change in % | |||||
|---|---|---|---|---|---|
| NA : A 10, (A 17) | Weight (1) | Feb./ Jan. | Jan./ Dec. | q-o-q (2) | y-o-y (3) |
| BE: INDUSTRY | 10000 | −0.3 | 0.1 | 0.3 | 4.5 |
| CZ: MANUFACTURING INDUSTRY | 8371 | −0.8 | 0.0 | 0.2 | 4.5 |
| Of which Exports | 2977 | −1.6 | 0.0 | −0.1 | 2.7 |
| (C1): Manufacture of food products and beverages | 1809 | 0.0 | 1.8 | −0.2 | 3.1 |
| (C2): Manufacture of coke and refined petroleum products | 423 | −3.7 | 4.9 | 8.3 | 9.6 |
| (C3): Machinery and equipment goods | 944 | 0.1 | 0.0 | −0.1 | 4.2 |
| (C4): Manufacture of transport equipment | 1387 | 0.4 | −4.6 | −2.0 | 3.6 |
| (C5): Other manufacturing | 3808 | −1.6 | 0.4 | 0.4 | 5.0 |
| DE: Mining and quarrying; energy; water supply; waste management | 1629 | 2.4 | 0.8 | 1.1 | 4.3 |
| FZ: CONSTRUCTION | 10000 | −1.7 | 1.9 | 2.1 | 7.4 |
- (1) 10000=B...E and F
- (2) Quarter-on-quarter: last three months / previous three months
- (3) Year-on-year: last three months / same three months of previous year
- The codes correspond to different levels of aggregation of the french aggregated classification of activites (NA 2008).
- Sources: DGFiP, INSEE
Significant downturn in “other manufacturing” (−1.6%)
The turnover in “other manufacturing” fell back sharply in February (−1.6% after +0.4% in January) with a decrease in every main subsector. The fall was particularly significant in the manufacture of chemicals and chemical products (−3.2% after +0.9%), in the manufacture of basic metals and fabricated metal products, except machinery and equipement (−2.3% after +2.0%) and in the manufacture of rubber and plastic products (−1.1% after +0.6%).
Export sales in “other manufacturing” also fell back (−3.8% after +2.2%).
Sharp contraction in coke and refined petroleum products (−3.7%)
The turnover in the manufacture of coke and refined petroleum products contracted sharply in February (−3.7% after +4.9% in January).
Increase in transport equipment (+0.4%)
In February, the turnover in the manufacture of transport equipment recovered slightly (+0.4% after −4.6%). It rebounded in the manufacture of other transport equipment (+1.6% after −9.5%). Converserly, it contracted in the manufacture of motor vehicles, trailers and semi-trailers (−1.0% after +1.0%).
In February, the turnover fell again in export sales but less than in January (−0.8% after −3.7%).
Virtual stability in machinery and equipment (+0.1%)
In February, the turnover in machinery and equipment was virtually stable (+0.1%) after a stability in January. It fell back in the manufacture of computer, electronic and optical products (−1.1%) whereas it rose in the manufacture of machinery and equipment n.e.c. (+0.6%) and in the manufacture of electrical equipment (+0.7%).
The export sales in machinery and equipment recovered (+0.9% after −0.5%).
Stability in food products and beverages
The turnover in the manufacture of food products and beverages was stable in February after an increase of 1.8% in January. It rose in export (+0.9% after +0.5%).
Revisions
The variation of the turnover index in January 2018 has been raised by 0.3 points in the manufacturing industry (stability instead of −0.4% in previous publication) as well as in industry as a whole (+0.1% instead of −0.2%).
tableauTable2 – Indices of turnover in industry and construction
| Change in % | |||||
|---|---|---|---|---|---|
| Industries: | Weight (1) | Feb. 2018 | Feb. Jan. | Jan./ Dec. | q-o-q (2) |
| BE: INDUSTRY | 10000 | 109.5 | −0.3 | 0.1 | 0.3 |
| CZ: MANUFACTURING INDUSTRY | 8371 | 108.0 | −0.8 | 0.0 | 0.2 |
| of which Exports | 2977 | 106.5 | −1.6 | 0.0 | −0.1 |
| (C1): Man. of food products and beverages | 1809 | 106.0 | 0.0 | 1.8 | −0.2 |
| of which Exports | 330 | 108.8 | 0.9 | 0.5 | −1.2 |
| (C2): Man. of coke and refined petroleum products | 423 | 113.9 | −3.7 | 4.9 | 8.3 |
| (C3): Machinery and equipment goods | 944 | 107.3 | 0.1 | 0.0 | −0.1 |
| of which Exports | 491 | 104.5 | 0.9 | −0.5 | −0.3 |
| [CI] Man. of computer, electronic and optical products | 286 | 107.9 | −1.1 | −0.2 | −0.7 |
| [CJ] Man. of electrical equipment | 225 | 107.1 | 0.7 | −0.6 | −0.2 |
| [CK] Man. of machinery and equipment n.e.c. | 433 | 107.1 | 0.6 | 0.5 | 0.3 |
| (C4): Man. of transport equipment | 1387 | 113.7 | 0.4 | −4.6 | −2.0 |
| of which Exports | 738 | 108.5 | −0.8 | −3.7 | −0.5 |
| [CL1] Man. of motor vehicles, trailers and semi-trailers | 648 | 118.5 | −1.0 | 1.0 | 0.0 |
| [CL2] Man. of other transport equipment | 739 | 109.6 | 1.6 | −9.5 | −3.9 |
| (C5): Other manufacturing | 3808 | 106.3 | −1.6 | 0.4 | 0.4 |
| of which Exports | 1367 | 104.9 | −3.8 | 2.2 | 0.2 |
| [CB] Man. of textiles, wearing apparel, leather and related products | 188 | 103.4 | −0.8 | 0.5 | 0.4 |
| [CC] Man. of wood and paper products; printing and reproduction of recorded media | 402 | 104.7 | −0.2 | 0.6 | 0.6 |
| [CE] Man. of chemicals and chemical products | 768 | 103.3 | −3.2 | 0.9 | 0.5 |
| [CF] Man. of basic pharmaceutical products and pharmaceutical preparations | 296 | 104.6 | −0.3 | −5.1 | −1.8 |
| [CG] Man. of rubber and plastics products, and other non-metallic mineral products | 613 | 107.5 | −1.1 | 0.6 | 0.5 |
| [CH] Man. of basic metals and fabricated metal products, except machinery and equipment | 867 | 110.2 | −2.3 | 2.0 | 1.8 |
| [CM] Other manufacturing; repair and installation of machinery and equipment | 673 | 106.0 | −0.5 | −0.3 | −0.8 |
| DE: Mining and quarrying; energy, water supply, sewerage, waste management | 1629 | 117.5 | 2.4 | 0.8 | 1.1 |
| [BZ] Mining and quarrying | 60 | 108.0 | −1.2 | 1.0 | 1.9 |
| [DZ] Electricity, gas, steam and air-conditioning supply | 1204 | 119.4 | 3.6 | 0.0 | 1.1 |
| [EZ] Water supply; sewerage, waste management and remediation | 365 | 112.9 | −0.9 | 3.5 | 1.0 |
| FZ: CONSTRUCTION | 10000 | 110.1 | −1.7 | 1.9 | 2.1 |
- (1) 10000=B...E and F
- (2) Quarter-on-quarter: last three months / previous three months
- Sources: DGFiP, INSEE
tableauTable3 – Revision of variations
| Jan./ Dec. | Dec./ Nov. | Nov./ Oct. | Q4 2017/Q3 2017 | 2017/2016 | |
|---|---|---|---|---|---|
| Industry (BE) | 0,27 | –0,13 | –0,08 | –0,15 | 0,00 |
| raw serie | 0,17 | 0,06 | 0,06 | 0,03 | 0,01 |
| SA-WDA parameters | 0,10 | –0,19 | –0,14 | –0,18 | –0,01 |
| Manufacturing industry (CZ) | 0,34 | –0,19 | –0,11 | –0,22 | 0,00 |
| raw serie | 0,02 | 0,05 | 0,07 | 0,02 | 0,01 |
| SA-WDA parameters | 0,32 | –0,24 | –0,18 | –0,24 | –0,01 |
- How to read it: in the manufacturing, the SA-WDA variation between December 2017 and January 2018 is revised by+ 0.34 points: +0.02 points are due to the raw series' revision and -0,32 points to the new calculation of the SA-WDA
- Sources: DGFiP, INSEE
Documentation
Turnover indices (pdf,32 Ko)