

 27 April 2018
2018- n° 119In March 2018, the turnover in large-scale food retailing rose again (+0.9%) Turnover in large-scale food retailing - March 2018
27 April 2018
2018- n° 119In March 2018, the turnover in large-scale food retailing rose again (+0.9%) Turnover in large-scale food retailing - March 2018
In March 2018, the turnover in large-scale food retailing rose again (+0.9% after +0.9% in February). The sales accelerated in food products (+1.6% after +1.0%) whereas they fell back in non-food products (−1.5% after +0.2%). Sales of automotive fuel rebounded (+0.6% after −3.2%).
Sales went up slightly in supermarkets (+0.2% after a virtual stability) and accelerated again in hypermarkets (+0.9% after +0.8%).
Increase over the last three months
Over the last three months (January to March), the turnover in large-scale food retailing went up compared to the previous three months (+1.5%). Over that period, sales increased markedly in automative fuel (+6.9%). They grew in food products (+0.9%) and in non-food products (+0.4%). Turnover increased both in supermarkets (+1.9%) and in hypermarkets (+1.1%).
Growth of 1.5% over a year
The turnover of the past three months in large-scale food retailing rose by 1.5% compared to the same period a year earlier. Sales grew in non-food products (+0.9%) whereas they decreased in food products (−1.6%). Sales of automotive fuel surged (+6.6%). Year on year, sales increased more in supermarkets (+1.9%) than in hypermarkets (+1.3%).
graphiqueGraph1 – Turnover in large-scale food retailing by type of retail stores
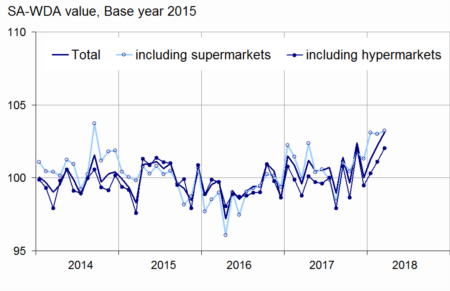
- Source: INSEE - Monthly survey of large-scale food retail activities (Emagsa)
graphiqueGraph2 – Turnover in super. and hypermarkets by type of products
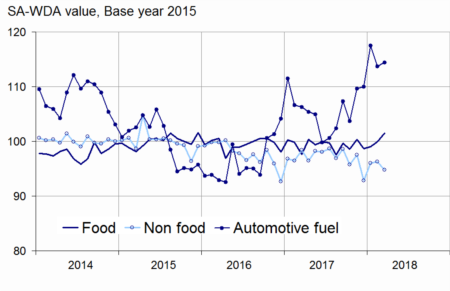
- Source: INSEE - Monthly survey of large-scale food retail activities (Emagsa)
graphiqueGraph3 – Turnover in supermarkets by type of products
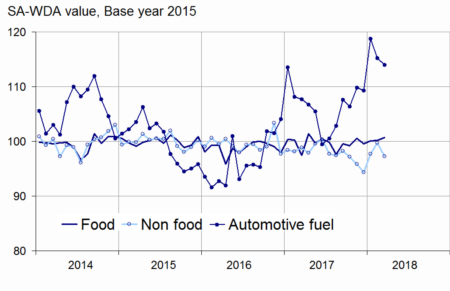
- Source: INSEE - Monthly survey of large-scale food retail activities (Emagsa)
graphiqueGraph4 – Turnover in hypermarkets by type of products
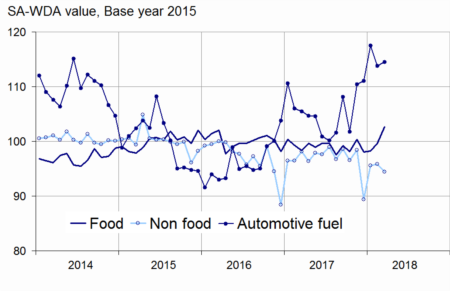
- Source: INSEE - Monthly survey of large-scale food retail activities (Emagsa)
tableauTable1 – Turnover in large-scale food retailing
| Variation en % | |||||
|---|---|---|---|---|---|
| Kind of stores or kind of products | Mar/ Feb. | Feb./Jan. | Jan./ Dec. | q-o-q (1) | y-o-y (2) |
| Turnover (*) | 0.9 | 0.9 | 1.2 | 1.5 | 1.5 |
| including | |||||
| Sales of food products(**) | 1.6 | 1.0 | 0.3 | 0.9 | 0.9 |
| Sales of non-food products(**) | –1.5 | 0.2 | 3.5 | 0.4 | –1.6 |
| Sales of automotive fuel(**) | 0.6 | –3.2 | 6.8 | 6.9 | 6.6 |
| including | |||||
| Supermarkets(***) | 0.2 | –0.1 | 1.7 | 1.9 | 1.9 |
| Hypermarkets(***) | 0.9 | 0.8 | 0.8 | 1.1 | 1.3 |
- (1) Quarter-on-quarter: last three months / previous three months (2) Year-on-year: last three months / same three months of previous year
- (*): including sales not in stores
- (**): sold in supermarkets or hypermarkets
- (***): excluding sales not in stores
- Source: INSEE - Monthly survey of large-scale food retailing activities (Emagsa)
tableauTable2 – Revisions of variations
| Feb./ Jan. | Jan./ Dec. | Dec./ Nov. | Q4 2017/ Q3 2017 | 2017/ 2016 | |
|---|---|---|---|---|---|
| Large-scale food retailing | 0.01 | –0.26 | 0.00 | 0.08 | 0.02 |
| raw serie | 0.00 | –0.41 | 0.07 | 0.02 | 0.01 |
| SA-WDA parameters | 0.01 | 0.15 | –0.07 | 0.06 | 0.01 |
- How to read it: Within large scale food retailing. the SA-WDA variation between January and February is revised by 0.01 points due to the new calculation of SA-WDA parameters.
- Source: INSEE - Monthly survey of large-scale food retailing activities (Emagsa)
Revisions
The variation in the turnover of large-scale food-retailing for February 2018 is unchanged at +0.9%.