26 April 2018
2018- n° 108In April 2018, developers' opinion on demand for new dwellings improves slightly Quaterly business survey in the real-estate development - April 2018
26 April 2018
2018- n° 108In April 2018, developers' opinion on demand for new dwellings improves slightly Quaterly business survey in the real-estate development - April 2018
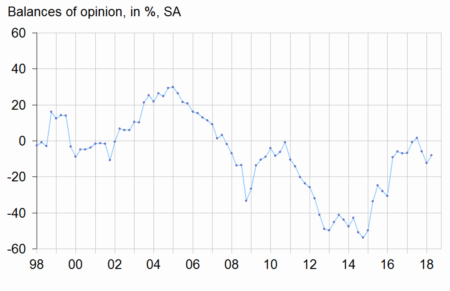
In April 2018, more developers than in January deem that the demand for new dwellings is high. The corresponding balance has recovered and has returned slightly above its long-term average.
In April 2018, more developers than in January deem that the demand for new dwellings is high. The corresponding balance has recovered and has returned slightly above its long-term average.
Prospects for housing starts recover a little
In April 2018, the outlook for housing starts for the next three months has improved slightly. The corresponding balance has edged up after two quarters of sharp decline and has moved closer to its long-term average. In detail, the balance on housing starts for sale is stable above average, whereas that on housing starts for rent has picked up, while remaining below its long-term average. At the same time, more developers than in January 2018 have indicated a decrease in unsold dwelling stocks. The corresponding balance has returned below its long-term average.
Average new housing price remains mostly reported as rising
Practically as many developers as in January have indicated a rise in the average price of new dwellings for sale; the corresponding balance of opinion is virtually stable markedly above its long-term average. About funding, as many developers as in January consider that downpayment to acquire a new dwelling has increased during the last few months, the balance remaining above its long-term average. Finally, nearly as many developers as in January think that the financing capacity to purchase new housing will increase over the next quarter; the balance also remains above its long-term average.
tableauTable1 – Real-estate development economic outlook
| Mean* | July 17 | Oct. 17 | Jan. 18 | April 18 | |
|---|---|---|---|---|---|
| New dwelling demand | –9 | 2 | –6 | –12 | –8 |
| Expected housing starts | –7 | 5 | –4 | –11 | –9 |
| - for sale | –15 | 0 | –5 | –12 | –12 |
| - for rent | 0 | 18 | –2 | –8 | –5 |
| Unsold dwelling stock tendency | –26 | –29 | –25 | –21 | –30 |
| Housing average price for sale | 4 | 11 | 9 | 15 | 16 |
| Downpayment | –20 | –10 | –14 | –11 | –11 |
| Financing capacity | –21 | –2 | –12 | –17 | –16 |
- * Mean since July 1991.
- Source: French business survey on real-estate development - INSEE
graphiqueGraph1 – New dwelling demand tendency