

 30 March 2018
2018- n° 91In February 2018, the turnover in large-scale food retailing rose again (+0.9%) Turnover in large-scale food retailing - February 2018
30 March 2018
2018- n° 91In February 2018, the turnover in large-scale food retailing rose again (+0.9%) Turnover in large-scale food retailing - February 2018
In February 2018, the turnover in large-scale food retailing rose again (+0.9% after +1.5% in January). The sales accelerated in food products (+1.0% after +0.7%) whereas they slowed down in non-food products (+0.3% after +3.7%). Sales of automotive fuel fell back strongly (−3.2% after +7.7%).
Sales went up again in supermarkets (+0.4% after +2.3%) and in hypermarkets (+0.7% after +0.7%).

In accordance with European directives, the index of turnover in large-scale food retailing use 2015 as base year from this publication.
In February 2018, the turnover in large-scale food retailing rose again (+0.9% after +1.5% in January). The sales accelerated in food products (+1.0% after +0.7%) whereas they slowed down in non-food products (+0.3% after +3.7%). Sales of automotive fuel fell back strongly (−3.2% after +7.7%).
Sales went up again in supermarkets (+0.4% after +2.3%) and in hypermarkets (+0.7% after +0.7%).
Virtual stability over the last three months
Over the last three months (December to February), the turnover in large-scale food retailing was near stable compared to the previous three months. Over that period, sales increased markedly in automative fuel (+6.9%). They decreased in non-food products (−2.2%) and more slightly in food products (−0.2%). Turnover grew in supermarkets (+2.1%) and edged down in hypermarkets (−0.4%).
Growth of 1.1% over a year
The turnover of the past three months in large-scale food retailing rose by 1.1% compared to the same period a year earlier. Sales decreased modestly in non-food products (−0.2%) whereas they flattened out in food products (+0.1%). However, sales of automotive fuel surged (+6.7%). Year on year, sales increased sharply in supermarkets (+2.6%) and very slightly in hypermarkets (+0.3%).
graphiqueGraph1 – Turnover in large-scale food retailing by type of retail stores
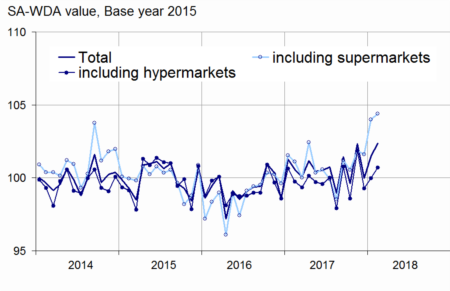
- Source: INSEE - Monthly survey of large-scale food retail activities (Emagsa)
graphiqueGraph2 – Turnover in super. and hypermarkets by type of products
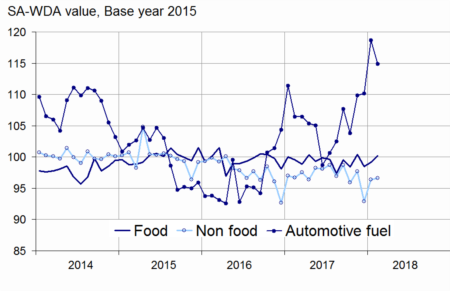
- Source: INSEE - Monthly survey of large-scale food retail activities (Emagsa)
graphiqueGraph3 – Turnover in supermarkets by type of products
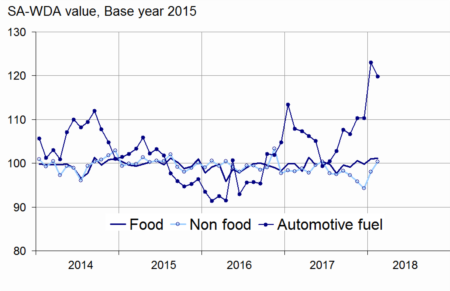
- Source: INSEE - Monthly survey of large-scale food retail activities (Emagsa)
graphiqueGraph4 – Turnover in hypermarkets by type of products
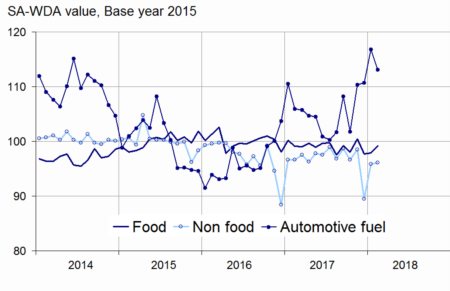
- Source: INSEE - Monthly survey of large-scale food retail activities (Emagsa)
tableauTable1 – Turnover in large-scale food retailing
| Variation en % | |||||
|---|---|---|---|---|---|
| Kind of stores or kind of products | Feb./Jan. | Jan./Dec. | Dec./Nov. | q-o-q (1) | y-o-y (2) |
| Turnover (*) | 0.9 | 1.5 | –2.3 | 0.1 | 1.1 |
| including | |||||
| Sales of food products(**) | 1.0 | 0.7 | –1.9 | –0.2 | 0.1 |
| Sales of non-food products(**) | 0.3 | 3.7 | –4.9 | –2.2 | –0.2 |
| Sales of automotive fuel(**) | –3.2 | 7.7 | 0.3 | 6.9 | 6.7 |
| including | |||||
| Supermarkets(***) | 0.4 | 2.3 | –0.2 | 2.1 | 2.6 |
| Hypermarkets(***) | 0.7 | 0.7 | –2.5 | –0.4 | 0.3 |
- (1) Quarter-on-quarter: last three months / previous three months (2) Year-on-year: last three months / same three months of previous year
- (*): including sales not in stores
- (**): sold in supermarkets or hypermarkets
- (***): excluding sales not in stores
- Source: INSEE - Monthly survey of large-scale food retailing activities (Emagsa)