

 30 March 2018
2018- n° 89In January 2018, the sales volume in overall trade fell back (−0.8%) Sales volume in wholesale and retail trade - January 2018
30 March 2018
2018- n° 89In January 2018, the sales volume in overall trade fell back (−0.8%) Sales volume in wholesale and retail trade - January 2018
In January 2018, the sales volume in overall trade fell back (−0.8%) after a virtual stability in December 2017. It shrank sharply in trade and repair of motor vehicles and motorcycles (−2.6% after +3.1%) and more moderately in wholesale trade (−0.5% after −0.1%). It kept decreasing in retail trade (−0.7% after −1.6%).
- The sales volume in overall trade rose by 0.7% over the last three months
- The sales volume rose by 3.9% over a year
- Sharp decline in trade and repair of motor vehicles and motorcycles
- Slight decline in wholesale trade
- Further decline in sales volume of retail trade
- Rebasing and reference change to 2015

In accordance with European directives, the index of sales volume in overall trade and the associated turnover indicators use 2015 as base year from this publication.
In January 2018, the sales volume in overall trade fell back (−0.8%) after a virtual stability in December 2017. It shrank sharply in trade and repair of motor vehicles and motorcycles (−2.6% after +3.1%) and more moderately in wholesale trade (−0.5% after −0.1%). It kept decreasing in retail trade (−0.7% after −1.6%).
The sales volume in overall trade rose by 0.7% over the last three months
Over the last three months (November to January), the sales volume in overall trade increased by 0.7% compared to the previous three months. It rose by 1.1% in retail trade – it increased in specialised stores (+1.3%), in non-specialised stores (+1.1%) and more moderately in retail trade not in stores (+0.6%). The sales volume rose by 1.8% in retail trade and repair of motor vehicles and by 0.2% in wholesale trade.
The sales volume rose by 3.9% over a year
Over the last three months, the sales volume in overall trade grew by 3.9% over a year. It increased markedly in all sectors. It rose by 3.3% in wholesale trade. It also rose sharply in retail trade (+4.0%) – it grew in specialised stores (+3.6%) and non-specialised stores (+2.7%) as well as in retail trade not in stores (+11.9%). It went up substantially in trade and repair of motor vehicles and motorcycles (+6.3%).
graphiqueGraph1 – Sales volume in wholesale trade and retail trade; repair of motor vehicles and motorcycles
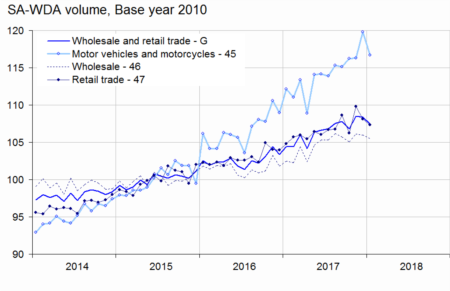
- Sources: DGFiP, INSEE
tableauTable1 – Sales volume in wholesale and retail trade
| Change in % | |||||
|---|---|---|---|---|---|
| NACE Classification | Weight | Jan./ Dec. | Dec./ Nov. | q-o-q (1) | y-o-y (2) |
| G Wholesale and retail trade ; repair of motor vehicles and motorcycles | 10000 | –0.8 | –0.1 | 0.7 | 3.9 |
| 45 Wholesale and retail trade and repair of motor vehicles and motorcycles | 1272 | –2.6 | 3.1 | 1.8 | 6.3 |
| 46 Wholesale trade, except of motor vehicles and motorcycles | 5777 | –0.5 | –0.1 | 0.2 | 3.3 |
| 47 Retail trade, except of motor vehicles and motorcycles | 2952 | –0.7 | –1.6 | 1.1 | 4.0 |
| 471 Retail sale in non- specialised stores | 1109 | –0.9 | –1.0 | 1.1 | 2.7 |
| 472 to 477 Retail sale in specialised stores | 1622 | –0.2 | –1.8 | 1.3 | 3.6 |
| 478 and 479 Retail trade not in stores | 221 | –3.0 | –2.7 | 0.6 | 11.9 |
- (1) Quarter-on-quarter: last three months /previous three months.
- (2) Year-on-year: last three months / same three months of the previous year.
- The codes correspond to different levels of aggregation of the classification NAF rev.2
- Sources: DGFiP, INSEE
Sharp decline in trade and repair of motor vehicles and motorcycles
In January 2018, the sales volume in trade and repair of motor vehicles and motorcycles shrank sharply (−2.6%) after a significant rise in December 2017 (+3.1%). It fell back strongly in sale of motor vehicle (−2.7% after +3.7%) and in sale of motor vehicle parts and accessories (−3.4% after +2.2%). By contrast, it bounced back in sale and repair of motorcycles (+1.0% after −1.0%) and it flattened out in maintenance and repair of motor vehicles.
Slight decline in wholesale trade
In January 2018, the sales volume in whosesale trade decreased slightly (−0.5% after −0.1% in December 2017). It fell back sharply in other specialised wholesale (−4.0% after +1.3%), in wholesale of other machinery, equipment and supplies (−2.1% after +1.7%) and more moderately in wholesale of information and communication equipment (−0.8% after +1.3%). By contrast, it bounced back in wholesale on a fee or contract basis (+2.8% after −2.2%) and in wholesale of food, beverages and tobacco (+1.3% after −0.9%).
Further decline in sales volume of retail trade
In January 2018, the sales volume in retail trade kept decreasing (−0.7% after −1.6% in December), especially for non-specialised stores (−0.9% after −1.0%) and for retail trade not in stores (−3.0% after −2.7%).
In specialised stores, the sales volume fell slightly (−0.2% after −1.8%). It fell back in retail of automotive fuel (−3.0% after +1.0%) and in retail of other goods (−0.5% after −1.9%). By contrast, it bounced back in retail of other household equipment (+1.6% after −3.3%) and in retail of information and communication equipment (+3.9% after −1.8%).
According to the first early estimates, the sales volume in retail trade except for motor vehicles and motorcycles should increase in February 2018 (+0.7%). It should grow by 2.9% year-on-year.
Rebasing and reference change to 2015
Sales volume indices are rebased every 5 years. From now on, they have reference year 2015, which means that they have for average 100 in 2015. The 2015 rebasing implements an innovation, with the introduction of a two-weighting system (instead of a constant-weight system) in order to better take into account the structural evolutions. This change responds to a recommandation of Eurostat in order to increase the robustness of indices over a long period. The methodological information concerning these base year and reference changes are available on the INSEE Website.
tableauTable2 – Sales volume in the retail trade ; repair of motor vehicles and motorcycles
| Change in % | |||||
|---|---|---|---|---|---|
| Nace Classification | Weight | Jan. 2018 | Jan./ Dec. | Dec./ Nov. | q-o-q (1) |
| G Wolesale and retail trade; repair of motor vehicles and motorcycles | 10000 | 107.5 | –0.8 | –0.1 | 0.7 |
| 45 Wholesale and retail trade and repair of motor vehicles and moto. | 1272 | 116.7 | –2.6 | 3.1 | 1.8 |
| 451 Sale of motor vehicles | 850 | 118.2 | –2.7 | 3.7 | 1.4 |
| 452 Maintenance and repair of motor vehicles | 89 | 111.0 | 0.0 | 1.2 | 1.4 |
| 453 Sale of motor vehicle parts and accessories | 306 | 114.5 | –3.4 | 2.2 | 3.0 |
| 454 Sale, maintenance and repair of moto. and related parts and accessories | 27 | 110.8 | 1.0 | –1.0 | 2.5 |
| 46 Wholesale trade, except of motor vehicles and moto. | 5777 | 105.5 | –0.5 | –0.1 | 0.2 |
| 461 Wholesale on a fee or contract basis | 813 | 107.5 | 2.8 | –2.2 | –0.4 |
| 462 Wholesale of agricultural raw materials and live animals | 390 | 98.6 | 0.6 | –5.8 | 3.4 |
| 463 Wholesale of food, beverages and tobacco | 1029 | 102.7 | 1.3 | –0.9 | –2.0 |
| 464 Wholesale of household goods | 1130 | 106.0 | 0.0 | 0.6 | 0.5 |
| 465 Wholesale of information and communication equipment | 331 | 117.4 | –0.8 | 1.3 | 0.8 |
| 466 Wholesale of other machinery, equipmt and supplies | 716 | 108.6 | –2.1 | 1.7 | 0.1 |
| 467 Other specialised wholesale | 1132 | 102.8 | –4.0 | 1.3 | 0.8 |
| 469 Non specialised wholesale trade | 236 | 106.7 | –0.7 | 2.4 | 2.0 |
| 47 Retail trade, except of motor vehicles and moto. | 2952 | 107.4 | –0.7 | –1.6 | 1.1 |
| 471 Non-specialised stores | 1109 | 105.2 | –0.9 | –1.0 | 1.1 |
| 472 to 477 Specialised stores | 1622 | 106.8 | –0.2 | –1.8 | 1.3 |
| 472 Retail sale of food. beverages and tobacco | 155 | 116.4 | 1.7 | –2.1 | 1.4 |
| 473 Retail sale of automotive fuel | 224 | 97.6 | –3.0 | 1.0 | 0.1 |
| 474 Retail sale of information and communication equipmt | 65 | 119.3 | 3.9 | –1.8 | 2.6 |
| 475 Retail sale of other household equipment | 310 | 107.4 | 1.6 | –3.3 | 1.7 |
| 476 Retail sale of cultural and recreation goods | 118 | 107.3 | –2.2 | –1.2 | 1.9 |
| 477 Retail sale of other goods | 750 | 106.2 | –0.5 | –1.9 | 1.2 |
| 478 et 479 Retail trade not in stores | 221 | 122.6 | –3.0 | –2.7 | 0.6 |
- (1) Quarter-on-quarter: last three months /previous three months.
- Sources: DGFiP, INSEE
Documentation
Sales volume index in trade (pdf,35 Ko)
La note méthodologique simplifiee_anglais (pdf,28 Ko)
Pour en savoir plus
Time series: Sales volume in wholesale and retail trade
Time series: Turnover index in wholesale and retail trade