

 31 January 2018
2018- n° 28In November 2017, the turnover in the manufacturing industry fell back slightly (−0.4%) Turnover in industry and construction - November 2017
31 January 2018
2018- n° 28In November 2017, the turnover in the manufacturing industry fell back slightly (−0.4%) Turnover in industry and construction - November 2017
In November 2017, the turnover fell back slightly in the manufacturing industry (−0.4%) after a strong progress in October (+2.2%). It fell back more sharply in exports (−1.7% after +3.2%).
In industry as a whole, the turnover also declined slightly in november (−0.3% after +1.7% in October).
- Sharp increase over the last three months (+2.6%)
- Strong increase compared to the previous year (+7.1%)
- Sharp downturn in transport equipment (−3.3%)
- Slight downturn in machinery and equipment (−0.2%)
- Virtual stability in food products and beverages (−0.1%)
- Further increase in coke and refined petroleum products (+2.5%)
- Slight increase in“other manufacturing” (+0.3%)
- Revisions

Please note: in accordance with European directives, the turnover indices in the industry will use 2015 as base year from the publication of the indices of January 2018, due on March 30, 2018.
In November 2017, the turnover fell back slightly in the manufacturing industry (−0.4%) after a strong progress in October (+2.2%). It fell back more sharply in exports (−1.7% after +3.2%).
In industry as a whole, the turnover also declined slightly in november (−0.3% after +1.7% in October).
Sharp increase over the last three months (+2.6%)
Despite the slight decrease in November, the turnover rose sharply over the last three months in the manufacturing industry (+2.6%) as well as in industry as a whole (+2.6%). Within manufacturing, the turnover grew sharply in the manufacture of transport equipment (+7.0%) and in the manufacture of coke and refined petroleum products (+9.4%). It rose also, but to a lesser extent in “other manufacturing” (+1.4%), in the machinery and equipment goods (+2.2%) and in the manufacture of food products and beverages (+0.5%).
Strong increase compared to the previous year (+7.1%)
The turnover grew sharply compared to the same three months of the previous year in the manufacturing industry (+7.1%). The growth was even more marked in industry as a whole (+7.9%) due to the strong increase in the mining and quarrying, energy, water supply, waste management (+11.4%). Over this period, the turnover rose sharply in every main sectors of the manufacturing industry − “other manufacturing” (+6.6%), the manufacture of transport equipment (+11.4%), the manufacture of food products and beverages (+3.7%), the machinery and equipment sector (+6.0%) and the manufacture of coke and refined petroleum products (+14.9%).
graphiqueGraph1 – Turnover in manufacturing industry
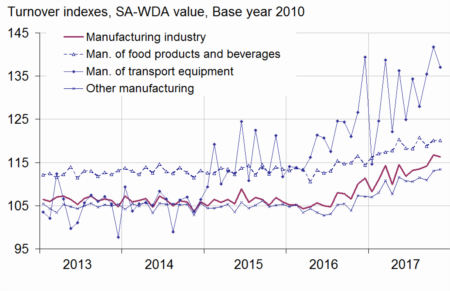
- Sources: DGFiP, INSEE
tableauTable1 – Variation of the turnover in industry and construction
| Change in % | |||||
|---|---|---|---|---|---|
| NA : A 10, (A 17) | Weight (1) | Nov./ Oct. | Oct./ Sept. | q-o-q (2) | y-o-y (3) |
| BE: INDUSTRY | 10000 | −0.3 | 1.7 | 2.6 | 7.9 |
| CZ: MANUFACTURING INDUSTRY | 8346 | −0.4 | 2.2 | 2.6 | 7.1 |
| Of which Exports | 2677 | −1.7 | 3.2 | 2.2 | 7.6 |
| (C1): Manufacture of food products and beverages | 1685 | −0.1 | 1.2 | 0.5 | 3.7 |
| (C2): Manufacture of coke and refined petroleum products | 561 | 2.5 | 2.1 | 9.4 | 14.9 |
| (C3): Machinery and equipment goods | 953 | −0.2 | 1.5 | 2.2 | 6.0 |
| (C4): Manufacture of transport equipment | 1265 | −3.3 | 4.6 | 7.0 | 11.4 |
| (C5): Other manufacturing | 3881 | 0.3 | 2.0 | 1.4 | 6.6 |
| DE: Mining and quarrying; energy; water supply; waste management | 1654 | 0.0 | −0.7 | 2.7 | 11.4 |
| FZ: CONSTRUCTION | 10000 | 0.1 | 1.1 | 1.3 | 6.2 |
- (1) 10000=B...E and F
- (2) Quarter-on-quarter: last three months / previous three months
- (3) Year-on-year: last three months / same three months of previous year
- The codes correspond to different levels of aggregation of the french aggregated classification of activites (NA 2008).
- Sources: DGFiP, INSEE
Sharp downturn in transport equipment (−3.3%)
The turnover in the manufacture of transport equipment fell back sharply in November (−3.3% after +4.6% in October). This decrease was mainly due to the strong downturn in the manufacture of motor vehicles, trailers and semi-trailers (−5.8% after +8.6%). The other transport equipment also slipped back but to a lesser extent (−0.9% after +1.2%). The turnover also fell back in export sales (−2.4% after +3.6%).
Slight downturn in machinery and equipment (−0.2%)
In November, the turnover in machinery and equipment edged down (−0.2% after +1.5% in October). It fell back in the manufacture of electrical equipment (−1.7 % after +1.3%), and in the manufacture of machinery and equipment n.e.c. (−0.4% after +1.4%). Conversely, it rose again in the manufacture of computer, electronic and optical products (+2.2% after +2.1%). Export sales in machinery and equipment fell back (−0.4% after +2.0%).
Virtual stability in food products and beverages (−0.1%)
The turnover in the manufacture of food products and beverages was virtually stable in November after an increase of 1.2% in October. It fell back in export sales (−1.0% after +1.9%).
Further increase in coke and refined petroleum products (+2.5%)
The turnover in the manufacture of coke and refined petroleum products rose again in November (+2.5% after +2.1% in October).
Slight increase in“other manufacturing” (+0.3%)
The turnover in “other manufacturing” rose slightly in November (+0.3% after +2.0% in October). It rose again in the manufacture of chemicals and chemical products (+1.7% after +2.2%), in the manufacture of textiles, wearing apparel, leather and related products (+3.2% after +1.2%) and in the manufacture of basic metals and fabricated metal products, except machinery and equipement (+0.6% after +1.9%). Conversely, it fell back in the other manufacturing; repair and installation of machinery and equipment (−0.9% after +3.4%), in the manufacture of wood and paper products (−1.1% after +1.3%) and in the manufacture of rubber and plastic products (−0.2% after +2.1%). The turnover decreased again in the manufacture of basic pharmaceutical products and pharmaceutical preparations (−0.7% after −0.3%). In export sales, the turnover fell back sharply in “other manufacturing” (−2.1% after +3.8%).
Revisions
The variation of the turnover index in October 2017 has been lowered by 0.1 points in the manufacturing industry, at +2.2% instead of 2.3%.
It is unchanged in industry as a whole, at +1.7%.
tableauTable2 – Indices of turnover in industry and construction
| Change in % | |||||
|---|---|---|---|---|---|
| Industries: | Weight (1) | Nov. 2017 | Nov. Oct. | Oct./ Sept. | q-o-q (2) |
| BE: INDUSTRY | 10000 | 119.1 | −0.3 | 1.7 | 2.6 |
| CZ: MANUFACTURING INDUSTRY | 8346 | 116.3 | −0.4 | 2.2 | 2.6 |
| of which Exports | 2677 | 122.8 | −1.7 | 3.2 | 2.2 |
| (C1): Man. of food products and beverages | 1685 | 120.1 | −0.1 | 1.2 | 0.5 |
| of which Exports | 285 | 126.7 | −1.0 | 1.9 | 0.2 |
| (C2): Man. of coke and refined petroleum products | 561 | 84.8 | 2.5 | 2.1 | 9.4 |
| (C3): Machinery and equipment goods | 953 | 112.6 | −0.2 | 1.5 | 2.2 |
| of which Exports | 469 | 109.8 | −0.4 | 2.0 | 1.0 |
| [CI] Man. of computer, electronic and optical products | 306 | 109.9 | −1.7 | 1.3 | 2.8 |
| [CJ] Man. of electrical equipment | 245 | 108.2 | 2.2 | 2.1 | 2.3 |
| [CK] Man. of machinery and equipment n.e.c. | 402 | 117.4 | −0.4 | 1.4 | 1.7 |
| (C4): Man. of transport equipment | 1265 | 137.1 | −3.3 | 4.6 | 7.0 |
| of which Exports | 617 | 143.2 | −2.4 | 3.6 | 5.1 |
| [CL1] Man. of motor vehicles, trailers and semi-trailers | 702 | 116.1 | −5.8 | 8.6 | 8.1 |
| [CL2] Man. of other transport equipment | 562 | 163.3 | −0.9 | 1.2 | 5.9 |
| (C5): Other manufacturing | 3881 | 113.4 | 0.3 | 2.0 | 1.4 |
| of which Exports | 1237 | 118.1 | −2.1 | 3.8 | 1.3 |
| [CB] Man. of textiles, wearing apparel, leather and related products | 188 | 117.1 | 3.2 | 1.2 | 0.5 |
| [CC] Man. of wood and paper products; printing and reproduction of recorded media | 436 | 100.8 | −1.1 | 1.3 | 0.3 |
| [CE] Man. of chemicals and chemical products | 745 | 110.6 | 1.7 | 2.2 | −0.6 |
| [CF] Man. of basic pharmaceutical products and pharmaceutical preparations | 304 | 117.5 | −0.7 | −0.3 | 1.8 |
| [CG] Man. of rubber and plastics products, and other non-metallic mineral products | 629 | 111.3 | −0.2 | 2.1 | 1.7 |
| [CH] Man. of basic metals and fabricated metal products, except machinery and equipment | 926 | 112.6 | 0.6 | 1.9 | 1.9 |
| [CM] Other manufacturing; repair and installation of machinery and equipment | 653 | 125.3 | −0.9 | 3.4 | 3.3 |
| DE: Mining and quarrying; energy, water supply, sewerage, waste management | 1654 | 133.3 | 0.0 | −0.7 | 2.7 |
| [BZ] Mining and quarrying | 70 | 97.4 | −0.2 | 1.7 | 3.2 |
| [DZ] Electricity, gas, steam and air-conditioning supply | 1205 | 138.2 | 0.3 | −1.5 | 2.6 |
| [EZ] Water supply; sewerage, waste management and remediation | 379 | 124.4 | −1.0 | 1.9 | 3.1 |
| FZ: CONSTRUCTION | 10000 | 112.8 | 0.1 | 1.1 | 1.3 |
- (1) 10000=B...E and F
- (2) Quarter-on-quarter: last three months / previous three months
- Sources: DGFiP, INSEE
tableauTable3 – Revision of variations
| Oct./ Sep. | Sept./ Aug. | Aug./ July | Q3 2017/ Q2 2017 | 2016/ 2015 | |
|---|---|---|---|---|---|
| Industry (BE) | −0.04 | −0.10 | 0.07 | −0.13 | 0.00 |
| raw serie | 0.23 | −0.02 | −0.01 | −0.01 | 0.00 |
| SA-WDA parameters | −0.27 | −0.08 | 0.08 | −0.12 | 0.00 |
| Manufacturing industry (CZ) | −0.05 | 0.02 | 0.09 | −0.05 | −0.01 |
| raw serie | 0.05 | −0.03 | −0.01 | −0.02 | 0.00 |
| SA-WDA parameters | −0.10 | 0.05 | 0.10 | −0.03 | −0.01 |
- How to read it: in the manufacturing industry, the SA-WDA variation between September and October 2017 is revised by −0,05 points: +0.05 points are due to the raw series' revision and −0,10 points to the new calculation of the SA-WDA.
- Sources: DGFiP, INSEE
Documentation
Methodology (pdf,140 Ko)
Pour en savoir plus
Time series : Turnover indices (VAT)