

 20 September 2017
2017- n° 248In August 2017, the prices of imported raw materials recovered Prices of oil and raw material imports - August 2017
20 September 2017
2017- n° 248In August 2017, the prices of imported raw materials recovered Prices of oil and raw material imports - August 2017
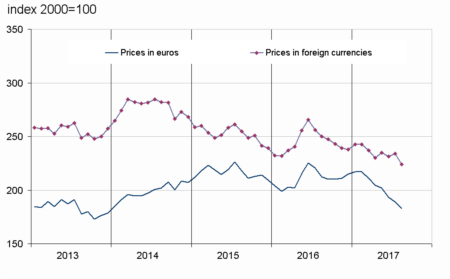
In August 2017, the price of crude oil in euros speeded up (+3.0% after +0.6%). The prices in euros of all other imported commodities picked up (+2.6%), after a five-month decrease. The prices of industrial raw materials increased more than in July (+5.8% after +0.9%). In contrast, the prices of raw food materials decreased again (−3.3% after −2.1%).
In August 2017, the price of crude oil in euros speeded up (+3.0% after +0.6%). The prices in euros of all other imported commodities picked up (+2.6%), after a five-month decrease. The prices of industrial raw materials increased more than in July (+5.8% after +0.9%). In contrast, the prices of raw food materials decreased again (−3.3% after −2.1%).
Oil price kept recovering
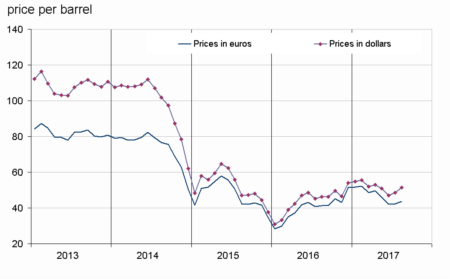
In August 2017, the price of North Sea crude oil (Brent) in euros recovered clearly (+3.0% after +0.6% in July) to an average of €43.5 per barrel. In dollars, the increase was more marked (+5.6% after +3.2%) because the euro appreciated during the month.
graphiqueGraph1 – Oil (Brent)
- Source : INSEE
tableauTable1 – Oil and petroleum products
| Prices | Change (%) | |||
|---|---|---|---|---|
| of last month | over the last month | over the last 3 months | over the last 12 months | |
| Brent in $ per barrel | 51.4 | 5.6 | 1.0 | 11.3 |
| Brent in € per barrel | 43.5 | 3.0 | –5.4 | 5.7 |
| Gasoline €/L | 0.386 | 6.6 | 4.1 | 18.6 |
| Gas Oil | 408.2 | 3.8 | –0.7 | 12.2 |
| Heavy fuel | 288.9 | 0.9 | –3.1 | 17.5 |
| Naphtha | 388.6 | 7.3 | –0.9 | 20.5 |
- Prices are in euros per tonne unless otherwise specified
- Source : INSEE
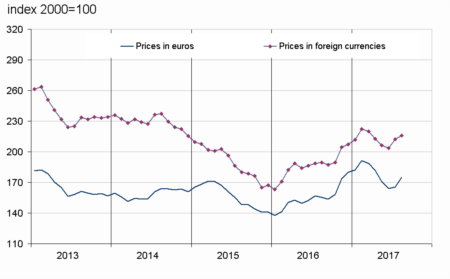
Industrial commodity prices increased sharply
In August 2017, the prices in euros of industrial raw materials rose sharply (+5.8% after +0.9%). This increase was mainly due to theprices of minerals, (+7.6% after +1.8%), particularly iron ore (+12.1% after +14.1%). The prices of non-ferrous metals bounced back (+6.8%) after a five-month decline, especially the price of nickel (+14.5% after −8.2%), as a consequence of an expected shortage following numerous mine closures worldwide. The prices of precious metals bounced back too (+4.5% after −5.6%). The prices of agro-industrial raw materials declined again, but less than in the previous month (−1.2% after −2.5%). Notably, the price of tropical wood declined less than in July (−0.4% after −1.8%), as those of hides (−3.6% after −8.6%). The price of wood pulp was virtually stable (−0.1% after −2.8%). However, the price of natural rubber fell back (−0.5% after +2.6%), and the price of natural fibres decreased more strongly (−5.0% after −3.9%).
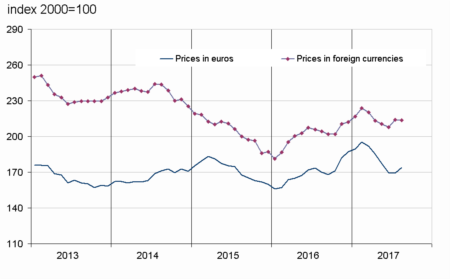
Food commodity prices decreased againsharply than in June
In euros, the prices of raw food materials decreased again (−3.3% after −2.1%) and reached their lower level since December 2013. The prices of all foodstuffs fell. The decrease in cereals prices became sharper (−5.9% after −1.8%). The prices of tropical foodstuffs declined again, but less than in July (−0.5% after −2.2%), as those of beef meat (−8.0% after −11.7%). The prices of oil seeds and vegetable oils slipped back (−1.9% after +1.8%), as well as those of sugar (−6.3% after +1.0%).
tableauTable2 – Imported raw materials (excluding energy) in euros
| Index | Changes (%) | |||
|---|---|---|---|---|
| of last month | over the last month | over the last 3 months | over the last 12 months | |
| Food total | 182.8 | –3.3 | –9.6 | –14.0 |
| Tropical foodstuffs | 160.1 | –0.5 | –6.8 | –24.1 |
| Oil seeds, vegetable oils | 214.7 | –1.9 | –5.5 | –8.6 |
| Cereals | 149.2 | –5.9 | –4.5 | 0.0 |
| Sugar | 125.8 | –6.3 | –20.8 | –37.1 |
| Beef meat | 130.0 | –8.0 | –22.2 | –9.2 |
| Industrial raw materials | 174.9 | 5.8 | 2.2 | 12.6 |
| Agricultural raw materials | 119.6 | –1.2 | –7.4 | 3.5 |
| Natural Fibres | 132.1 | –5.0 | –14.1 | –3.2 |
| Natural rubber | 141.7 | –0.5 | –6.0 | 4.2 |
| Hides | 60.0 | –3.6 | –15.6 | –20.5 |
| Wood pulp | 102.3 | –0.1 | –2.6 | 4.1 |
| Tropical wood | 91.6 | –0.4 | –6.1 | –6.1 |
| Sawn softwood | 110.0 | –2.4 | –13.0 | 4.9 |
| Minerals | 203.9 | 7.6 | 4.9 | 15.0 |
| Iron ore | 482.2 | 12.1 | 16.4 | 20.7 |
| Non-ferrous metals | 166.1 | 6.8 | 2.9 | 15.9 |
| Precious metals | 237.8 | 4.5 | –2.6 | –8.6 |
| All commodities | 173.8 | 2.6 | –2.0 | 2.2 |
- Source : INSEE
graphiqueGraph3 – Food
- Source : INSEE
graphiqueGraph2 – Imported raw materials (excluding energy)
- Source : INSEE
graphiqueGraph4 – Industrial raw materials
- Source : INSEE
Pour en savoir plus
Time series : Raw materials prices