

 31 May 2017
2017- n° 146In Q1 2017, producer prices for services sold to French businesses were stable Services producer price indices - first quarter 2017
31 May 2017
2017- n° 146In Q1 2017, producer prices for services sold to French businesses were stable Services producer price indices - first quarter 2017
In the first quarter of 2017, producer prices of services sold to French businesses were stable after a slight rebound in the previous quarter (+0.3%). Year over year, they rose at a slightly faster pace (+0.6% after +0.4%).
- SPPI, production sold to French businesses
- Rise in prices for real estate activities and transport and storage services
- Virtual stability in prices for administrative and support services
- Downturn in prices for the other services
- SPPI, production sold to households in France
- SPPI, production sold on foreign markets
- SPPI (all markets)
SPPI, production sold to French businesses
In the first quarter of 2017, producer prices of services sold to French businesses were stable after a slight rebound in the previous quarter (+0.3%). Year over year, they rose at a slightly faster pace (+0.6% after +0.4%).
Rise in prices for real estate activities and transport and storage services
Prices for real estate activities recovered (+0.9% after −0,7%), mainly thanks to renting and operating services of real estate. Prices for transport and storage services also increased (+0.4% after −0.1%) and sped up year over year (+1.3% after +0.7%). In particular, prices for freight transport by road grew at a similar pace as in the previous month (+0.4% after +0.5%).
Virtual stability in prices for administrative and support services
Prices for administrative and support services remained vitually stable (+0.1% as in the two previous quarters). Year over year, they grew by 0.5% (after +0.6%).
Downturn in prices for the other services
Prices for information-communication services fell back (−0.6% after +0.9%). Year over year, they remained on a slight increase trend (+0.2%) The decrease over the quarter was mainly due to the seasonal downturn in prices for television programming and broadcasting activities (−7.0% after +13.6%). Prices for scientific and technical services went down slightly (−0.2%), mainly due to the decline in prices for media representation services at this time of year. Finally, prices for accomodation-food services aimed to professionnals also slipped down seasonally (−1.0% after +0.6%).
SPPI, production sold to households in France
In the first quarter of 2017, producer prices of services sold to households in France recovered somewhat (+0.3% after −1.3%) notably because of the slight seasonal rebound in prices for accomodation-food services (+0.4% after −2.2%) and that for real estate activities (+0.3% after −1.6%).
SPPI, production sold on foreign markets
Producer prices of services sold on foreign markets were stable in the first quarter of 2017, as in the previous quarter. The decline in prices of information-communication services (−0.4% after +0.4%) offset the rise in prices of administrative and support services (+0.3% after +0.8%). Prices of other services were stable or virtually.
SPPI (all markets)
In the first quarter of 2017, on all markets, producer prices of services were virtually stable (+0.1%). Year over year, they gathered pace: +0.7% after 0.3% at the end of 2016.
graphiqueGraphique1 – Producer price indices for all services
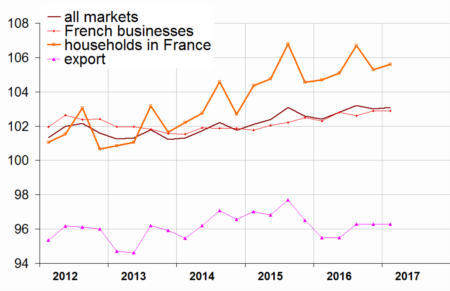
- Source: INSEE
graphiqueGraphique2 – Producer price indices of services sold to French businesses
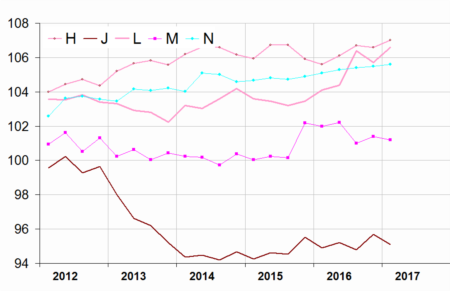
- Source: INSEE
graphiqueGraphique3 – Services producer price indices, all markets
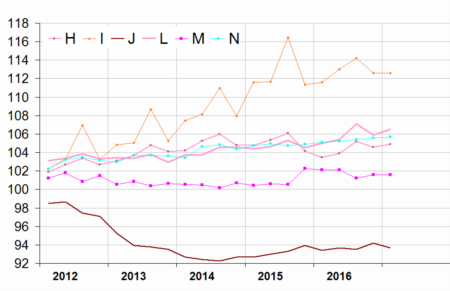
- Source: INSEE
tableauTableau1 – Services producer price indices, by sector:
| Sections and choices of | Weight | Indices | Change in % | |
|---|---|---|---|---|
| levels in NAF rev.2 | 2017T01 | Q/Q-1 | Q/Q-4 | |
| Prices of services sold to French businesses (BtoB) | ||||
| HN : all services | 1000 | 102.9 | 0.0 | 0.6 |
| H : transport. and storage | 184 | 107.0 | 0.4 | 1.3 |
| 49 : land and pipeline transport | 81 | 106.2 | 0.5 | 1.8 |
| 52 : warehousing and auxiliary services for transport | 73 | 107.2 | 0.3 | 0.5 |
| I : accommodation and food | 44 | 110.5 | –1.0 | 0.2 |
| J : information and communic. | 227 | 95.1 | –0.6 | 0.2 |
| 62 : IT services | 88 | 102.3 | –0.3 | 0.6 |
| L : real estate activities | 105 | 106.6 | 0.9 | 2.4 |
| M : prof., scient. and tech. | 214 | 101.2 | –0.2 | –0.8 |
| 69 : Legal and accounting services | 46 | 104.2 | 0.3 | –0.9 |
| 70 : activities of head offices and management consulting services | 43 | 102.8 | –0.2 | –1.5 |
| 71 : Architectural and engineering services | 83 | 100.3 | 0.1 | –1.0 |
| 73 : Advertising and market research services | 26 | 97.4 | –2.7 | 0.3 |
| N : administ. and support serv. | 218 | 105.6 | 0.1 | 0.5 |
| 77 : renting & leasing services | 61 | 99.2 | –0.1 | –0.2 |
| 78 : employment services | 50 | 108.3 | –0.3 | 0.4 |
| 82 : Office administrative and support services | 55 | 108.3 | –0.1 | 0.6 |
| Prices of services sold to households in France (BtoC) | ||||
| HN : all services | 1000 | 105.6 | 0.3 | 0.9 |
| H : transport. and storage | 151 | 108.7 | 0.5 | 1.9 |
| I : accommodation and food | 258 | 113.6 | 0.4 | 1.2 |
| J : information and communic. | 184 | 91.1 | –0.3 | 0.2 |
| L : real estate activities | 284 | 106.4 | 0.3 | 0.5 |
| M : prof., scient. and tech. | 69 | 103.4 | 0.8 | 1.0 |
| N : administ. and support serv. | 40 | 97.9 | 0.1 | –0.9 |
| Export prices of services (BtoE) | ||||
| HN : all services | 1000 | 96.3 | 0.0 | 0.8 |
| H : transport. and storage | 315 | 91.6 | 0.0 | 1.0 |
| J : information and communic. | 155 | 81.0 | –0.4 | 0.4 |
| M : prof., scient. and tech. | 225 | 101.3 | 0.1 | 0.3 |
| N : administ. and support serv. | 296 | 106.1 | 0.3 | 1.4 |
| Prices of services sold on all markets (BtoAll) | ||||
| HN : all services | 1000 | 103.1 | 0.1 | 0.7 |
| H : transport. and storage | 190 | 104.9 | 0.3 | 1.4 |
| I : accommodation and food | 94 | 112.6 | 0.0 | 0.9 |
| J : information and communic. | 208 | 93.7 | –0.5 | 0.3 |
| L : real estate activities | 139 | 106.5 | 0.6 | 1.4 |
| M : scient. and tech. services | 178 | 101.6 | 0.0 | –0.5 |
| N : administ. and support serv. | 181 | 105.7 | 0.1 | 0.6 |
- s: statistical confidentiality
- BtoB: business to business
- BtoC: business to consumer
- BtoE: business to exports
- BtoAll: business to all
- Source: INSEE
tableauTableau3 – Revision of variations
| Services producer price indices | 2016T04 / 2016T03 |
|---|---|
| - services sold to all markets | // |
| - services sold to French businesses | // |
| - services sold to consumers in France | // |
| - export of services | // |
- //: unchanged compared to the previous release
- How to read it : there was no change in the variation of the services price index for services sold to French businesses between the third quarter 2016 and the fourth quarter 2016. Published at the end of February 2017at +0.3%, it has not been revised.
- Source: INSEE
Documentation
Simplified methodology (pdf,134 Ko)
Pour en savoir plus
Time series : Services producer price indices