

 15 November 2016
2016- n° 293Decline in business start-ups in October 2016 Enterprise births - October 2016
15 November 2016
2016- n° 293Decline in business start-ups in October 2016 Enterprise births - October 2016
In October 2016, the number of business births for all entreprises declined by 2.0%, following two months of growth, seasonally and working-day adjusted. Start-ups excluding self-managed micro-entrepreneurs shrank for the first time since February (−3.8%). Micro-entrepreneurs' registrations rose again, but more slowly (+0.8% after +2.6% in September).
In October 2016, the number of business births for all entreprises declined by 2.0%, following two months of growth, seasonally and working-day adjusted. Start-ups excluding self-managed micro-entrepreneurs shrank for the first time since February (−3.8%). Micro-entrepreneurs' registrations rose again, but more slowly (+0.8% after +2.6% in September).
graphiqueGraph1EN – Business start-ups (sa-wda *)
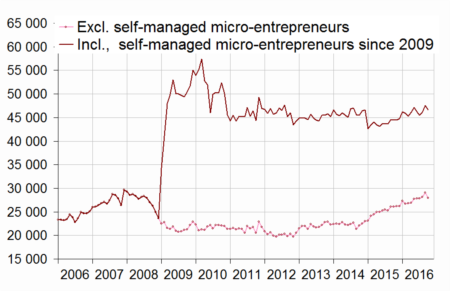
- * Seasonally and working-day adjusted data
- Source: INSEE (Sirene)
tableautab1EN – Business set-ups by month (sa-wda *)
| July 2016 | Aug. 2016 | Sept. 2016 | Oct. 2016 | |
|---|---|---|---|---|
| Excl. self-managed micro-entrepreneurs | 27,881 | 28,144 | 29,072 | 27,981 |
| Variation [m-o-m] % | 0.3 | 0.9 | 3.3 | -3.8 |
| Incl. self-managed micro-entrepreneurs | 45,511 | 46,149 | 47,552 | 46,602 |
| Variation [m-o-m] % | -1.5 | 1.4 | 3.0 | -2.0 |
- * Seasonally and working-day adjusted data
- Source: INSEE (Sirene)
+4.7% year-on-year (three months basis)
The raw amount of births added up in the last three months advanced markedly compared to the same period one year before (+4.7%). This increase was the result of sole proprietorship start-ups excluding self-managed micro-entrepreneurs (+12.4%) and company births (+6.5%). Only micro-entrepreneurs' registrations decreased slightly during this period (−0.7%). Transportation and business support activities were once again the sectors that contributed the most to the overall rise1.
tableautab2EN – Business start-ups by type
| Moving total % change * | Moving total | Moving total | ||
|---|---|---|---|---|
| over 3 months | over 12 months | January- October 2016 | January- October 2015 | |
| Total | 4.7 | 4.7 | 466,009 | 440,108 |
| Companies | 6.5 | 10.1 | 156,308 | 141,608 |
| Sole proprietorships (SP) | 3.9 | 2.1 | 309,701 | 298,500 |
| SP excluding self-managed micro-entrepreneurs | 12.4 | 14.2 | 121,198 | 108,977 |
| Self-managed micro-entrepreneurs | -0.7 | -4.3 | 188,503 | 189,523 |
- * Total of business start-ups during the last 3 or 12 months compared with the same months a year earlier
- Source: INSEE (Sirene)
+4.7% year-on-year (twelve months basis)
The raw number of business start-ups totted up during the last twelve months speeded up again (+4.7% year-on-year following +4.1% in September and +3.5% in August). This was due to the surge in births of sole proprietorship excluding self-managed micro-entrepreneurs (+14.2%) and of companies (+10.2%). On the other hand, self-managed micro-entrepreneurs' registrations went down once more (−4.3%) but this drop eased (−6.6% in September and −8.4% in August).
Two business set-ups out of five are self-managed micro-entrepreneurs' registrations
In October 2016, micro–entrepreneurs' registrations amounted to 40.4% of the businesses set up over the twelve last months. One year before, the share was 44.2%.
tableautab0EN – Business set-ups distribution by type
| Aug. 2016 | Sept. 2016 | Oct. 2016 | |
|---|---|---|---|
| Companies | 33.8 | 33.8 | 33.9 |
| Sole proprietorships excluding self-managed micro-entrepreneurs | 25.4 | 25.7 | 25.7 |
| Self-managed micro-entrepreneurs | 40.8 | 40.5 | 40.4 |
- Source: INSEE (Sirene)

1 The contribution of a sector to the overall variation is the observed variation of this sector, weighted by the share of this sector in the total number of births.
Revisions
The variation in the overall number of business births in September 2016 has been raised by 0.1 points to +3.0% due to the update of the SA parameters and the revision of raw data.
Business set-ups by economic activity
graphiqueGraph2EN – Trade and business support activities start-ups (sa-wda *)
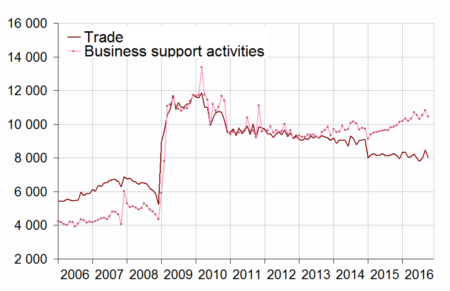
- * Seasonally and working-day adjusted data
- Source: INSEE (Sirene)
graphiqueGraph3EN – Construction and transportation business set-ups (sa-wda *)
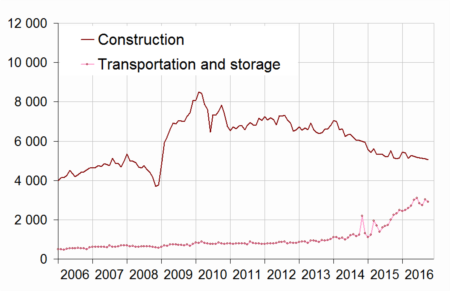
- * Seasonally and working-day adjusted data
- Source: INSEE (Sirene)
tableautab3EN – Number of business set-ups (incl. self-managed micro-enterprises)
| NA | Aug. 2016 | Sept. 2016 | Oct. 2016 | |
|---|---|---|---|---|
| Total | 46,149 | 47,552 | 46,602 | |
| Industry | BE | 1,973 | 2,078 | 2,028 |
| Of which Manufacturing | C | 1,774 | 1,809 | 1,755 |
| Construction | FZ | 5,137 | 5,094 | 5,046 |
| Wholesale and retail trade, Transport, Accommodation and Food and beverage activities | GI | 13,292 | 14,275 | 13,789 |
| Trade | G | 7,990 | 8,472 | 8,033 |
| Transportation and storage | H | 2,738 | 3,026 | 2,907 |
| Accommodation and food service activities | I | 2,597 | 2,612 | 2,711 |
| Information and communication | JZ | 2,389 | 2,312 | 2,217 |
| Financial and insurance activities | KZ | 1,281 | 1,326 | 1,421 |
| Real estate activities | LZ | 1,605 | 1,636 | 1,671 |
| Business support activities | MN | 10,547 | 10,838 | 10,439 |
| Public administration and defence, education, human health and social work activities | OQ | 5,823 | 5,833 | 5,925 |
| Other services activities | RS | 4,101 | 4,160 | 4,066 |
- * Seasonally and working-day adjusted data
- Source: INSEE (Sirene)
tableautab3bisEN – Fluctuation in the number of business set-ups (incl. self-managed micro-entrepreneurs)
| NA | Oct. 16 / Sept. 16 | Moving total % change** | ||
|---|---|---|---|---|
| sa-wda * | over 3 months | over 12 months | ||
| Total | -2.0 | 4.7 | 4.7 | |
| Industry | BE | -2.4 | 0.1 | -1.1 |
| Of which Manufacturing | C | -3.0 | -0.9 | -1.2 |
| Construction | FZ | -0.9 | -5.3 | -4.6 |
| Wholesale and retail trade, Transport, Accommodation and Food and beverage activities | GI | -3.4 | 8.4 | 8.6 |
| Trade | G | -5.2 | -1.3 | -1.5 |
| Transportation and storage | H | -3.9 | 43.2 | 61.1 |
| Accommodation and food service activities | I | 3.8 | 10.3 | 6.6 |
| Information and communication | JZ | -4.1 | 7.8 | 6.5 |
| Financial and insurance activities | KZ | 7.1 | 4.2 | 2.9 |
| Real estate activities | LZ | 2.2 | 9.4 | 13.4 |
| Business support activities | MN | -3.7 | 7.4 | 8.2 |
| Public administration and defence, education, human health and social work activities | OQ | 1.6 | 5.1 | 3.7 |
| Other services activities | RS | -2.3 | -1.2 | -1.8 |
- * Seasonally and working-day adjusted data
- ** Total of business start-ups during the last 3 or 12 months compared with the same months a year earlier
- Source: INSEE (Sirene)
Pour en savoir plus
Time series : Business demography