

 26 June 2015
2015- n° 159In April 2015, the sales volume rebounded in retail trade and in accommodation and
food service activities Sales volume in the retail trade and personal services - April 2015
26 June 2015
2015- n° 159In April 2015, the sales volume rebounded in retail trade and in accommodation and
food service activities Sales volume in the retail trade and personal services - April 2015
In April 2015, the sales volume recovered in retail trade, except of motor vehicles and motorcycles (+0.7%) and in accommodation and food service activities (+1.6%). It went on growing in trade and repair of motor vehicles and motorcycles (+0.5%). On the contrary, it slightly decreased in household services (–0.2%).

Except for indices from Emagsa survey, every index in this issue is in volume (tax excluded) and seasonally and working-day adjusted (SA-WDA). The commentary shows variations of subsections by decreasing contribution. The contribution of a subsection depends on the extent of the change and on its weight.
In April 2015, the sales volume recovered in retail trade, except of motor vehicles and motorcycles (+0.7%) and in accommodation and food service activities (+1.6%). It went on growing in trade and repair of motor vehicles and motorcycles (+0.5%). On the contrary, it slightly decreased in household services (–0.2%).
graphiqueGraph1_Anglais – Volume of sales in the retail trade and personal services
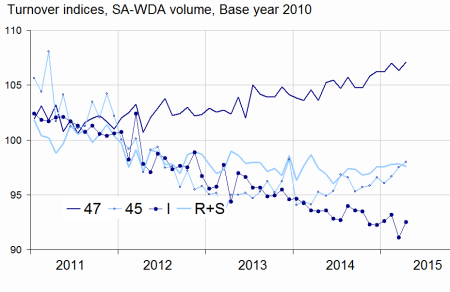
- Source: INSEE
Rebound in retail trade except of motor vehicles and motorcycles
In April, the sales volume recovered in retail trade, except of motor vehicles and motorcycles (+0.7% after –0.6%). According to early estimates, this growth would go on in May 2015 (+0.6%).
The sales volume improved in non-specialised stores (+0.5%) and more significantly in specialised stores (+0.9%), mainly in the retail sale of other goods (clothings, shoes,…) (+0.9%), of other household equipment (+1.1%), of cultural and recreation goods (+1.9%) and in the retail sale of food, beverages and tobacco (+1.7%).
The sales volume in retail trade, except of motor vehicles and motorcycles increased over the last three months (+0.7%, q-o-q) and over the year (+2.8%).
tableauTab1_anglais – Variation of sales volume in the retail trade and personal services
| Change in % | |||||
|---|---|---|---|---|---|
| NACE Classification | Weight | Apr/ Mar | Mar/ Feb. | q-o-q (1) | y-o-y (2) |
| 47 Retail trade, except of motor vehicles and motorcycles | 1000 | 0.7 | –0.6 | 0.7 | 2.8 |
| 471 Retail sale in non-specialized stores | 369 | 0.5 | –0.2 | 0.9 | 1.6 |
| 472 to 477 Retail sale in specialized stores | 573 | 0.9 | –0.9 | 0.7 | 3.5 |
| 478 and 479 Retail trade not in stores | 58 | 0.8 | –0.2 | –0.7 | 2.1 |
| 45 Trade and repair of motor vehicles and motorcycles | 1000 | 0.5 | 0.9 | 1.3 | 3.0 |
| I Accommodation and food service activities | 1000 | 1.6 | –2.2 | –0.1 | –1.6 |
| R+S Household services | 1000 | –0.2 | 0.1 | 0.4 | –0.2 |
| R Arts, entertainment and recreation | 449 | 0.1 | –0.4 | 0.5 | 0.7 |
| S Other service activities | 551 | –0.4 | 0.4 | 0.3 | –0.9 |
- (1) Quarter-on-quarter: last three months / previous three months.
- (2) Year-on-year: last three months / same three months of the previous year.
- The codes correspond to different levels of aggregation of the classification NAF rev.2
- Source: INSEE
tableauTabprecoce_anglais – Variation of sales volume in the retail trade: early estimate*
| Change in % | ||
|---|---|---|
| May 2015/ Apr 2015 | May 2015/ May 2014 | |
| 47 Retail trade, except of motor vehicles and motorcycles | 0.6 | 2.4 |
- * Econometric estimate from a set of sources available within 30 days after the end of the reference month
- Source: INSEE
Third-month-in-a-row growth in trade and repair of motor vehicles and motorcycles
The sales volume in retail trade and repair of motor vehicles and motorcycles went on growing in April (+0.5% after +0.9% in March and +0.6% in February), mainly in sale of motor vehicles (+0.6%).
The sales volume increased over the last three months (+1.3% q-o-q) and more strongly year on year (+3.0%).
tableauTab2_anglais – Variation of sales volume in the retail trade and personal services
| Change in % | |||||
|---|---|---|---|---|---|
| Nace Classification | Weight | Apr 2015 | Apr/ Mar | Mar/ Feb. | q-o-q (1) |
| 47 Retail trade, except of motor vehicles and motorcycles | 1000 | 107.1 | 0.7 | –0.6 | 0.7 |
| 471 Non-specialised stores | 369 | 100.1 | 0.5 | –0.2 | 0.9 |
| 472 to 477 Specialised stores | 573 | 111.7 | 0.9 | –0.9 | 0.7 |
| 472 Retail sale of food, beverages and tobacco in specialised stores | 49 | 104.9 | 1.7 | –0.4 | 0.4 |
| 473 Retail sale of automotive fuel | 78 | 96.4 | 0.4 | –1.3 | –1.6 |
| 474 Retail sale of information and communication equipment | 28 | 150.9 | –0.8 | –1.6 | –0.2 |
| 475 Retail sale of other household equipment | 112 | 102.0 | 1.1 | –1.5 | 1.2 |
| 476 Retail sale of cultural and recreation goods | 48 | 104.7 | 1.9 | –2.3 | 0.7 |
| 477 Retail sale of other goods in specialised stores | 258 | 118.9 | 0.9 | –0.3 | 1.2 |
| 478 et 479 Retail trade not in stores | 58 | 106.0 | 0.8 | –0.2 | –0.7 |
| 45 Wholesale and retail trade and repair of motor vehicles and motorcycles | 1000 | 98.0 | 0.5 | 0.9 | 1.3 |
| 451 Sale of motor vehicles | 671 | 98.0 | 0.6 | 1.7 | 1.1 |
| 452 Maintenance and repair of motor vehicles | 78 | 91.5 | 0.0 | 1.6 | 1.3 |
| 453 Sale of motor vehicle parts and accessories | 227 | 101.2 | 0.1 | –1.4 | 1.7 |
| 454 Sale, maintenance and repair of motorcycles and related parts and accessories | 24 | 89.1 | 1.3 | –0.1 | 1.3 |
| I Accommodation and food service activities | 1000 | 92.5 | 1.6 | –2.2 | –0.1 |
| 55 Accommodation | 255 | 95.9 | 1.9 | –3.3 | 0.5 |
| 56 Food and beverage service activities | 745 | 91.3 | 1.4 | –1.9 | –0.4 |
| 561 Restaurants… | 549 | 90.1 | 2.1 | –2.4 | –0.7 |
| 562 Event catering… | 116 | 101.7 | –0.5 | –0.2 | 1.6 |
| 563 Beverage serving activities | 80 | 84.8 | 0.3 | –1.1 | –1.2 |
| R+S Household services | 1000 | 97.6 | –0.2 | 0.1 | 0.4 |
| R Arts, entertainment and recreation | 449 | 97.6 | 0.1 | –0.4 | 0.5 |
| 90 Creative, arts and entertainment activities | 115 | 96.5 | –1.2 | 1.0 | 1.7 |
| 91 Libraries, archives, museums… | 11 | 111.2 | –3.0 | 1.4 | 4.2 |
| 92 Gambling and betting activities | 119 | 108.6 | 0.7 | 0.9 | 1.9 |
| 93 Sports activities and amusement... | 204 | 91.0 | 0.6 | –2.2 | –1.3 |
| S Other service activities | 551 | 97.6 | –0.4 | 0.4 | 0.3 |
| 95 Repair of computers… | 228 | 97.3 | –1.1 | 1.5 | –0.2 |
| 96 Other personal service activities | 323 | 97.9 | 0.0 | –0.4 | 0.6 |
- (1) Quarter-on-quarter: last three months / previous three months.
- Source: INSEE
Upturn in accommodation and food service activities
The sales volume in accommodation and food service activities recovered strongly in April (+1.6% after –2.2%) due to the sharp rebound in restaurants and fast food services (+1.4% after –1.9% in March). It also rebounded in accommodation (+1.9% after –3.3%).
The sales volume of the whole sector was nearly stable over the last three months (–0.1% q-o-q) and down year on year (–1.6%).
Slight decline in household services
In April, the sales volume in household services decreased very slightly (–0.2% after +0.1%). It declined particularly in repair of computers (–1.1%), and in creative, arts and entertainment activities (–1.2%). Conversely it rose in sports activities and amusement (+0.6%) and in gambling and betting activities (+0.7%).
The sales volume in household services increased over the last three months (+0.4%) but was slightly down year-on-year (–0.2%).
Revisions
The change for March 2015 was revised by +0.2 points in wholesale and retail trade and repair of motor vehicles and motorcycles, by +0.1 point in retail trade, except of motor vehicles and motorcycles and by –0.1 points in household services. It was unchanged in accommodation and food service activities.
Monthly survey on large-scale food retailing in May 2015
In May 2015, turnover in large-scale food retailing went on growing (+1.8% after +1.3%). Sales of automotive fuel accelerated again (+2.8% after +2.2%). Sales of food products recovered significantly (+1.8% after +0.1%), while those of non-food products dropped (–1.7% after +3.8%).
tableauTab3_anglais – Monthly turnover indices in large-scale food retailing
| Change in % | ||||
|---|---|---|---|---|
| May/ Apr | Apr/ Mar | q-o-q (1) | y-o-y (1) | |
| Turnover | 1.8 | 1.3 | 0.8 | 0.0 |
| Including | ||||
| Sales of food products | 1.8 | 0.1 | 0.0 | 1.2 |
| Sales of non-food products | –1.7 | 3.8 | 3.0 | 0.3 |
| Sales of automotive fuel | 2.8 | 2.2 | 3.1 | –6.6 |
- (1) Quarter-on-quarter: last three months / previous three months.
- Source: INSEE - Monthly survey on large scale food retailing (Emagsa)
Documentation
Methodology (pdf,121 Ko)