

 30 January 2015
2015- n° 22Household consumption of goods increased in December (+1.5%), and was almost stable
over the fourth quarter of 2014 (+0.1%) Household consumption expenditure on goods - December 2014
30 January 2015
2015- n° 22Household consumption of goods increased in December (+1.5%), and was almost stable
over the fourth quarter of 2014 (+0.1%) Household consumption expenditure on goods - December 2014
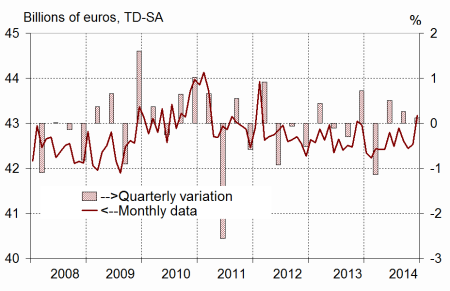
In December 2014, household consumption expenditure on goods increased sharply: +1.5% in volume*, after +0.2% in November. This rise was especially attributable to the marked rebound in consumption of energy (+6.9% in December). Over the fourth quarter, household expenditure on goods was almost stable (+0.1%). Over the year 2014, they decreased slightly anew (–0.2% after –0.3% in 2013), despite the recovery in the consumption of manufactured goods (+0.7% in 2014 after –0.6%) .
- Engineered goods : almost stable in December, increasing over the quarter
- Durables: increasing over the quarter
- Textile-leather: rise in December and over the quarter
- Other engineered goods: growing over the fourth quarter
- Food products: increasing in December and over the quarter
- Energy: rebound in December, downturn over the quarter
- The variation in November is scaled down by 0.2 points
In December 2014, household consumption expenditure on goods increased sharply: +1.5% in volume*, after +0.2% in November. This rise was especially attributable to the marked rebound in consumption of energy (+6.9% in December). Over the fourth quarter, household expenditure on goods was almost stable (+0.1%). Over the year 2014, they decreased slightly anew (–0.2% after –0.3% in 2013), despite the recovery in the consumption of manufactured goods (+0.7% in 2014 after –0.6%) .
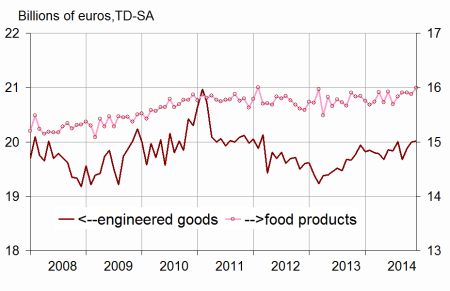
Engineered goods : almost stable in December, increasing over the quarter
Durables: increasing over the quarter
Household expenditure on durable goods stepped back in December (–0.5%), after being virtually flat in November (+0.1%). Expenditure on household durables dropped (–0.9%), after two consecutive months of increase. Car purchases went down again (–0.3% after –1.5% in November).
Over the fourth quarter, expenditure on durable goods rose at the same pace as the previous quarter (+0.7%). In detail, expenditure on household durables kept increasing in Q4 (+1.8% after +3.0% in Q3), whereas car purchases decreased anew, but to a lesser extent (–0.3% after –1.0%).
Textile-leather: rise in December and over the quarter
Consumption of textile, clothing and leather increased less sharply (+1.4% after +2.2%). Over the fourth quarter, purchases accelerated slightly (+0.5% after +0.2%).
[* Volumes are chained and all figures are trading days and seasonally adjusted.]
graphiquegraph1_new_ang – Total consumption of goods
graphiquegraph2_new_ang – Food and engineered goods
graphiquegraph3_new_ang – Breakdown of engineered goods
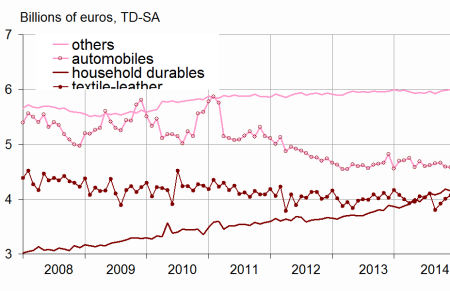
Other engineered goods: growing over the fourth quarter
Consumption expenditure on other engineered goods was almost stable in December (+0.1%, after +0.3%). However, it increased over the quarter (+0.7%).
Food products: increasing in December and over the quarter
In December, consumption of food products increased again (+0.7% after 2 months virtually flat). Over the fourth quarter, it bounced back (+0.7% after –0.3%).
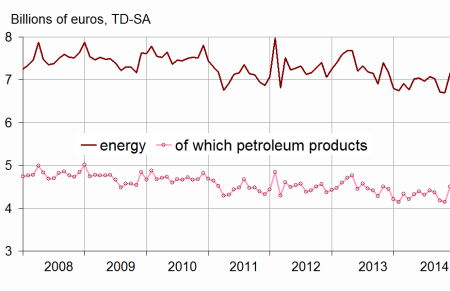
Energy: rebound in December, downturn over the quarter
After three consecutive months of decline, household consumption of energy products recovered substantially in December (+6.9%), notably because of fuel and heating expenditure.
Nevertheless, consumption of energy products decreased over the fourth quarter (–2.3% after +1.2% in Q3) due to a decrease in heat consumption in October, related to temperatures above seasonal norms.
The variation in November is scaled down by 0.2 points
Household consumption of goods is scaled down by 0.2 points: it is now estimated at +0.2% in November, instead of +0.4% within the previous publication. Conversely, the estimation in October is scaled up by 0.4 points (–0.4%, instead of –0.8% as previously estimated).
These revisions are mainly due to the integration of new information, as well as the updating of the seasonal adjustment coefficients, particularly regarding energy.
graphiquegraph4_new_ang – Energy
tableauenglish_trim – Household consumption expenditure on goods
| Oct. | Nov. | Dec. | Dec.2014/ | Q4 14/ | |
|---|---|---|---|---|---|
| 2014 | 2014 | 2014 | Dec.2013 | Q3 14 | |
| Food products | 15.900 | 15.879 | 15.991 | ||
| Change (%) | 0.0 | –0.1 | 0.7 | 0.9 | 0.7 |
| Engineered goods | 19.876 | 19.995 | 20.015 | ||
| Change (%) | 1.0 | 0.6 | 0.1 | 0.4 | 0.6 |
| Durables | 9.998 | 10.006 | 9.960 | ||
| Change (%) | 0.4 | 0.1 | –0.5 | 0.1 | 0.7 |
| - of which automobiles | 4.659 | 4.590 | 4.578 | ||
| Change (%) | 0.2 | –1.5 | –0.3 | –5.0 | –0.3 |
| - of which household durables | 4.115 | 4.185 | 4.146 | ||
| Change (%) | 1.0 | 1.7 | –0.9 | 6.8 | 1.8 |
| Textile-leather | 3.922 | 4.009 | 4.067 | ||
| Change (%) | 3.2 | 2.2 | 1.4 | 1.0 | 0.5 |
| Other engineered goods | 5.964 | 5.985 | 5.991 | ||
| Change (%) | 0.7 | 0.3 | 0.1 | 0.4 | 0.7 |
| Energy | 6.713 | 6.702 | 7.162 | ||
| Change (%) | –4.5 | –0.2 | 6.9 | 0.0 | –2.3 |
| - including petroleum products | 4.172 | 4.137 | 4.505 | ||
| Change (%) | –4.6 | –0.8 | 8.9 | 1.2 | –2.1 |
| Total | 42.445 | 42.525 | 43.167 | ||
| Change (%) | –0.4 | 0.2 | 1.5 | 0.5 | 0.1 |
| Manufactured goods | 36.651 | 36.628 | 37.084 | ||
| Change (%) | 0.3 | –0.1 | 1.2 | 0.9 | 0.6 |
Documentation
Methodology (pdf,23 Ko)