

 13 February 2015
2015- n° 32Decrease in business start-ups in January 2015 Enterprise births - January 2015
13 February 2015
2015- n° 32Decrease in business start-ups in January 2015 Enterprise births - January 2015
In January 2015, following three months of increase, the number of business start-ups including self-managed micro-entrepreneurs plunged by 7.8%, seasonally and working-day adjusted (sa-wda). However the number of business start-ups excluding self-managed micro-entrepreneurs went up by 1.2%.

Warning: Since December 19, 2014, new provisions defined by the Pinel law of 18 June 2014 apply to self-managed enterprises, now called micro-entrepreneurs instead of “auto-entrepreneurs”. This new denomination is used from December 2014 business start-ups data onward.
This status must be distinguished from both simplified tax scheme (sometimes called tax regime of micro-enterprise) and category of microenterprises defined under Article 51 of the law on the modernization of the economy (LME) and specified by Decree No. 2008-1354.
In January 2015, following three months of increase, the number of business start-ups including self-managed micro-entrepreneurs plunged by 7.8%, seasonally and working-day adjusted (sa-wda). However the number of business start-ups excluding self-managed micro-entrepreneurs went up by 1.2%.
-1.6% year-on-year (quarterly basis)
The amount of births added up in the last three months went down compared to the same months one year before (–1.6% for all enterprises, and –4.3% for self-managed micro-entrepreneurs).
The sectors that most contributed1 to that decrease were construction and retail.
+0.9% year-on-year (twelve months basis)
During the last twelve months, the number of business start-ups rose (+0.9% year-on-year), especially for companies (+3.7%). On the other hand, it slightly decreased for sole proprietorships (-0.2%).
More than half of business set-ups are self–managed micro-entrepreneurs
In January 2015, 51% of business set-ups over the last twelve months were micro–entrepreneurs.
tableautab0EN – Business set-ups distribution by type %
| Nov. 2014 | Dec. 2014 | Jan. 2015 | |
|---|---|---|---|
| Companies | 30.1 | 30.1 | 30.3 |
| Sole proprietorships excluding self-managed micro-entrepreneurs | 18.4 | 18.4 | 18.7 |
| Self-managed micro-entrepreneurs | 51.5 | 51.5 | 51.0 |
- Source: INSEE (Sirene)
tableautab1EN – Business set-ups by month (sa-wda *)
| Oct. 2014 | Nov. 2014 | Dec. 2014 | Jan. 2015 | |
|---|---|---|---|---|
| Excl. self-managed micro-entrepreneurs | 22,086 | 22,442 | 22,737 | 23,008 |
| Variation [m-o-m] % | 2.0 | 1.6 | 1.3 | 1.2 |
| Incl., self-managed micro-entrepreneurs | 45,716 | 46,225 | 46,863 | 43,224 |
| Variation [m-o-m] % | 0.5 | 1.1 | 1.4 | -7.8 |
- * Seasonally and working-day adjusted data
- Source: INSEE (Sirene)
tableautab2EN – Business start-ups by type
| Moving total % change* | Moving total | Moving total | ||
|---|---|---|---|---|
| over 3 months | over 12 months | in January 2015 | in January 2014 | |
| Total | -1.6 | 0.9 | 46,745 | 52,547 |
| Companies | 2.0 | 3.7 | 14,139 | 14,906 |
| Sole proprietorships | -3.1 | -0.2 | 32,606 | 37,641 |
| Of which self-managed micro-entrepreneurs | -4.3 | 0.8 | 21,612 | 26,934 |
- * Total of business start-ups during the last 3 or 12 months compared with the same months a year earlier
- Source: INSEE (Sirene)
graphiqueGraph1EN – Business start-ups (sa-wda *)
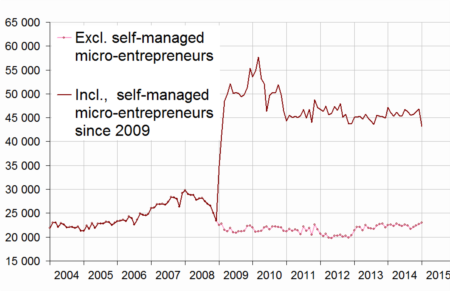
- * Seasonally and working-day adjusted data
- Source: INSEE (Sirene)
(1) The contribution of a sector to the overall variation is the observed variation of this sector, weighted by the share of this sector in the total number of births.
Pour en savoir plus
Time series : Business demography