

 27 February 2015
2015- n° 46In the fourth quarter 2014, producer prices of services sold to French businesses
were stable Services producer price indices - 4th quarter 2014
27 February 2015
2015- n° 46In the fourth quarter 2014, producer prices of services sold to French businesses
were stable Services producer price indices - 4th quarter 2014
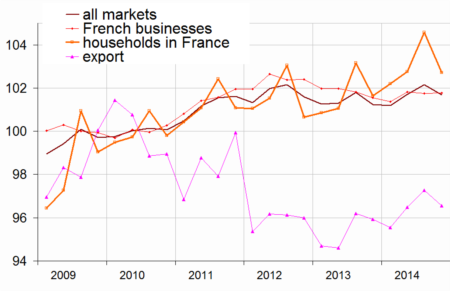
In the fourth quarter of 2014, producer prices of services sold to French businesses were unchanged (0.0% following –0,1% in the last quarter).
- SPPI, production sold to French businesses
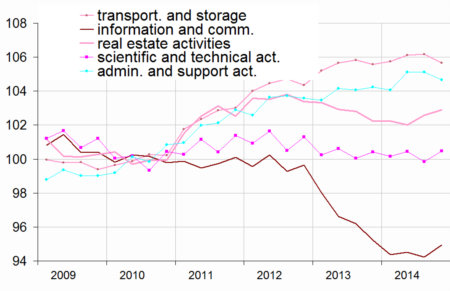
- Rise in prices for information and communication services (+0.8%) and professional, scientific and technical services (+0.6%)
- Prices for transportation and storage services(–0.5%) and administrative and support (–0.4%) services moved down
- SPPI, production sold to households in France
- SPPI, production sold on foreign markets
- SPPI (all markets)
SPPI, production sold to French businesses
In the fourth quarter of 2014, producer prices of services sold to French businesses were unchanged (0.0% following –0,1% in the last quarter).
Rise in prices for information and communication services (+0.8%) and professional, scientific and technical services (+0.6%)
In Q4 2014, the seasonal rise in prices for advertising spaces affected prices for media representation services (+11.1% following –8.9%) and for programming and broadcasting services (+16.0% following –11.9%).
Prices for legal and accounting services moved up (+0.6% following +0.2%), especially for accounting services (+0.9% following 0.0%).
Prices for IT services (+0.2% following +0.1%); engineering services (+0.2% following –0.5%), and management consulting services (+0.2% following –0.6%) accelerated slightly.
Prices for real estate services increased again (+0.3% following +0.5%)
Prices for transportation and storage services(–0.5%) and administrative and support (–0.4%) services moved down
In Q4 2014, prices for sea and coastal water freight transport services declined significantly, but less than in the previous quarter (–2.4% following –7.4%). Prices for freight road transport services also fell (–0.6% following +0.2%). Conversely, prices for freight air transport services continued to rise (+1.1% following +1.2%).
Prices for rental and leasing services dropped (–0.5% following 0.0%), most notably for machinery and equipment (–0.7% following 0.0%). Prices for employment activities rebounded (+0.5% following –0.6%), mainly due to higher prices for temporary employment agency services (+0.6% following –0.6%).
SPPI, production sold to households in France
Producer price of services sold to households in France moved down (–1.8%), most notably for passenger transport services (–2.1%), accomodation and food services (–2.9%), and administrative and support services (–4.4% after +3.5%).
SPPI, production sold on foreign markets
Producer prices of services sold on foreign markets moved down (–0.7% after +0.8%). Prices for transportation and storage services fell significantly (–2.7%), mainly due to the seasonal decline in prices for passenger air transport services and the significant decline in prices for sea and coastal water freight transport services (–1.5% following –2.0%).
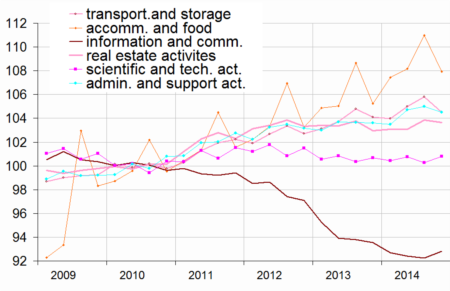
SPPI (all markets)
On all markets, services producer prices dropped in the fourth quarter of 2014 (–0.5%). However, year–over–year, they were on the rise (+0.4%).
graphiqueGraphique1 – Producer price indices for all services
graphiqueGraphique2 – Producer price indices of services sold to French businesses
graphiqueGraphique3 – Services producer price indices, all markets
tableauTableau1 – Services producer price indices, by sectors:
| Sections and choices of | Weight | Indices | Change in % | |
|---|---|---|---|---|
| levels in NAF rev.2 | 2014Q04 | Q/Q-1 | Q/Q-4 | |
| Prices of services sold to French businesses (BtoB) | ||||
| HN : all services | 1000 | 101.8 | 0.0 | 0.2 |
| H : transport. and storage | 187 | 105.7 | –0.5 | 0.1 |
| 49.41 : freight road. transp | 65 | 105.5 | –0.6 | –0.2 |
| J : information and comm. | 222 | 95.0 | 0.8 | –0.3 |
| 62 : IT services | 87 | 101.7 | 0.2 | 0.7 |
| L : real estate activities | 100 | 102.9 | 0.3 | 0.7 |
| M : prof., scient. and tech. | 200 | 100.5 | 0.6 | 0.1 |
| 69 : legal and accounting | 38 | 104.6 | 0.6 | 0.3 |
| 70.2 : manag. consult. | 43 | 102.4 | 0.2 | 0.5 |
| 71.12 : engineering | 64 | 98.7 | 0.2 | 0.3 |
| 73.1 : advertising | 26 | 96.2 | 3.9 | –1.7 |
| N : administ. and support | 260 | 104.6 | –0.4 | 0.4 |
| 77.1 : renting of motor veh. | 17 | 102.5 | –0.3 | 0.3 |
| 77.3 : renting of mach. | 30 | 102.1 | –0.7 | –0.4 |
| 78 : employment activities | 50 | 107.5 | 0.5 | 0.6 |
| 81 : services to buildings and landscape activities | 28 | 104.8 | –0.3 | –0.1 |
| S95 : repair of computers & pers. & household goods | 9 | 105.6 | 0.1 | –1.1 |
| Prices of services sold to households in France (BtoC) | ||||
| HN : all services | 1000 | 102.7 | –1.8 | 1.1 |
| H : transport. and storage | 168 | 106.6 | –2.1 | 2.2 |
| I : accomodation and food | 337 | 108.0 | –2.9 | 2.6 |
| J : information and comm. | 186 | 88.0 | 0.3 | –1.8 |
| L : real estate activities | 177 | 104.8 | –1.4 | 0.6 |
| M : prof., scient. and tech. | 71 | 103.0 | –0.1 | 0.2 |
| N : administ. and support | 43 | 99.5 | –4.3 | –0.2 |
| S95 : repair of computers & pers. & household goods | 18 | 108.9 | 0.2 | 1.0 |
| Export prices of services (BtoE) | ||||
| HN : all services | 1000 | 96.5 | –0.7 | 0.7 |
| H : transport. and storage | 473 | 96.0 | –2.7 | –0.5 |
| 49.41 : freight road transp. | 64 | 107.4 | –0.1 | 0.0 |
| 51.21 : freight air transport | 21 | 132.4 | 2.8 | 0.9 |
| 53 : postal & courier serv. | 13 | 114.1 | 0.0 | 3.2 |
| JB : telecommunications | 51 | 54.5 | –0.7 | –9.8 |
| 62 : IT services | 23 | 100.7 | 1.0 | 0.5 |
| 70.22 : bus. & mgt consult. | 46 | 96.6 | 1.0 | 0.5 |
| 71.12 : eng. & tech consult. | 66 | 104.0 | 0.5 | 2.2 |
| 77.40 : licensing services | 146 | 104.8 | 1.6 | 8.9 |
| Prices of services sold on all markets (BtoAll) | ||||
| HN : all services | 1000 | 101.7 | –0.5 | 0.4 |
| H : transport. and storage | 200 | 104.5 | –1.2 | 0.4 |
| I : accomodation and food | 98 | 107.9 | –2.7 | 2.5 |
| J : information and comm. | 208 | 92.8 | 0.6 | –0.7 |
| L : real estate activities | 113 | 103.6 | –0.2 | 0.7 |
| M : prof., scient. and tech. | 167 | 100.8 | 0.6 | 0.1 |
| N : administ. and support | 204 | 104.4 | –0.5 | 0.8 |
| S95 : repair of computers & pers. & household goods | 11 | 106.9 | 0.2 | –0.2 |
tableauTableau3 – Measure of revision for each indicator at the HN 'all services' level
| Services producer price indices | 2014Q03 / 2014Q02 |
|---|---|
| - services sold to all markets | // |
| - services sold to French businesses | // |
| - services sold to consumers in France | // |
| - export of services | 0.1(1) |
- (1) Reading note : the change in indice between the second and third quarter of 2014 published at the end of November 2014 was +0.7%. It has been revised to +0.8 % ; that is to say a revision of +0.1 point.
- Source: INSEE
Documentation
Simplified methodology (pdf,134 Ko)
Pour en savoir plus
Time series : Services producer price indices