

 27 November 2015
2015- n° 293In the third quarter of 2015, producer prices of services sold to French businesses
were stable Services producer price indices - Third quarter 2015
27 November 2015
2015- n° 293In the third quarter of 2015, producer prices of services sold to French businesses
were stable Services producer price indices - Third quarter 2015
In the third quarter of 2015, producer prices of services sold to French businesses were stable, following +0.4% in the second quarter.
- SPPI, production sold to French businesses
- Decrease in prices for information and communication services, scientific and technical services, and real estate activities
- Near stability of prices for administrative and support services
- Stability of prices for transportation and storage
- SPPI, production sold to households in France
- SPPI, production sold on foreign markets
- SPPI (all markets)
SPPI, production sold to French businesses
In the third quarter of 2015, producer prices of services sold to French businesses were stable, following +0.4% in the second quarter.
Decrease in prices for information and communication services, scientific and technical services, and real estate activities
Prices for information and communication services weakened this quarter (–0.4% after +0.4%) driven down by the fall in prices for programming and broadcasting services (–10.3%) ; in contrast, prices for publishing services grew (+0.8%) as those for information services (+0.5%).
Prices for scientific and technical services slipped (–0.3%), driven by the seasonal fall in prices for advertising services (–3.1%). The decrease was more important on television, cinema and billboards.
Prices for real estate activities declined slightly (–0.3% following +0.3%), driven down by prices for renting and operating services of own or leased real estate which dipped by 0.3% too.
Near stability of prices for administrative and support services
Prices for administrative and support services were virtually stable (–0.1%), especially those for buildings and landscape activities (+0.1%). Nevertheless, prices for employment activities dropped (0.9%), in particular prices for temporary employment agency services (–1.1%).
Stability of prices for transportation and storage
Prices for transportation and storage services were unchanged. However, prices for freight transport services by road decreased (–1,0%) owing to gasoil price fall and greater competition.
SPPI, production sold to households in France
Producer prices of services sold to households in France advanced sharply this quarter (+1.8% following +0.6%), driven up by a seasonal rise in prices for services related to tourism. Year over year, the increase was more moderate (+1.0%).
SPPI, production sold on foreign markets
Producer prices of services sold on foreign markets were stable in the third quarter. Prices for computer programming, consultancy and related services moved up (+0.8%), especially those for computer consultancy services (+1.1%). In contrast, prices for freight air transport services declined (–4.3% following –4.1% in the second quarter).
SPPI (all markets)
In the third quarter of 2015, on all markets, services producer prices advanced anew (+0.5% after +0.4%), driven up by producer prices of services sold to households. Year over year, they rose by 0.4%.
graphiqueGraphique1 – Producer price indices for all services
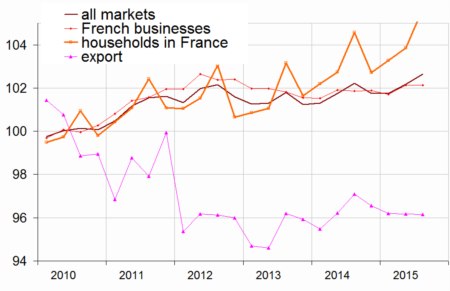
- base and reference year: 2010
- Source: INSEE
graphiqueTableau1 – Producer price indices of services sold to French businessesServices producer price indices, all markets
- base and reference year: 2010
- base and reference year: 2010
- Source: INSEE
- Source: INSEE
tableauTableau1 – Services producer price indices, by sectors:Measure of revision for each indicator at the HN 'all services' level
| Sections and choices of | Weight | Indices | Change in % | |
|---|---|---|---|---|
| levels in NAF rev.2 | 2015Q03 | Q/Q-1 | Q/Q-4 | |
| Prices of services sold to French businesses (BtoB) | ||||
| HN : all services | 1000 | 102.1 | 0.0 | 0.3 |
| H : transport. and storage | 187 | 106.8 | 0.0 | 0.2 |
| 49.41 : freight trans. by road | 65 | 104.3 | –1.0 | –1.8 |
| J : information and comm. | 222 | 94.4 | –0.4 | 0.2 |
| 62 : IT services | 87 | 102.0 | 0.3 | 0.7 |
| L : real estate activities | 100 | 104.0 | –0.3 | 0.4 |
| M : prof., scient. and tech. | 200 | 100.0 | –0.3 | 0.2 |
| 69 : legal and accounting | 38 | 105.2 | –0.1 | 1.3 |
| 70.2 : mgmt. consulting serv. | 43 | 103.4 | –0.3 | 1.5 |
| 71.12 : engineering | 64 | 97.5 | 0.1 | –0.8 |
| 73.1 : advertising | 26 | 92.9 | –3.1 | 0.4 |
| N : administ. and support | 260 | 104.7 | –0.1 | –0.3 |
| 77 : renting & leasing serv. | 83 | 99.3 | –0.7 | –1.6 |
| 78 : employment activities | 50 | 106.8 | –0.9 | –0.3 |
| 81 : services to buildings and landscape activities | 28 | 105.7 | 0.1 | 0.5 |
| S95 : repair of computers and person. and household goods | 9 | 105.1 | –0.4 | –0.4 |
| Prices of services sold to households in France (BtoC) | ||||
| HN : all services | 1000 | 105.7 | 1.8 | 1.0 |
| H : transport. and storage | 168 | 110.8 | 2.0 | 1.7 |
| I : accomodation and food | 337 | 113.3 | 3.4 | 1.9 |
| J : information and comm. | 186 | 89,3 | 0.2 | 1.7 |
| L : real estate activities | 177 | 107.0 | 1.2 | 0.7 |
| M : prof.. scient. and tech. | 71 | 102.7 | 0.1 | –0.5 |
| N : administ. and support | 43 | 102.6 | 3.0 | –1.0 |
| S95 : repair of computers and person. and household goods | 18 | 109.2 | –0.1 | 0.5 |
| Export prices of services (BtoE) | ||||
| HN : all services | 1000 | 96.1 | 0.0 | –1.0 |
| H : transport. and storage | 473 | 93.5 | 0.5 | –5.1 |
| 49.41 : freight transp. by road | 64 | 107.9 | –0.1 | 0.2 |
| 51.21 : freight air transport | 21 | 120.8 | –4.3 | –6.4 |
| 53 : postal and courier serv. | 13 | 122.9 | 0.0 | 7.7 |
| JB : telecommunications | 51 | 53.6 | 0.0 | –2.5 |
| 62 : IT services | 23 | 100.5 | 0.8 | 1.0 |
| 70.2 : mgmt. consulting serv. | 48 | 95.9 | –1.1 | –0.5 |
| 71.12 : engin. & tech. consult. | 66 | 104.0 | 0.0 | 0.6 |
| 77.40 : licensing services | 146 | 111.2 | 0.1 | 8.6 |
| Prices of services sold on all markets (BtoAll) | ||||
| HN : all services | 1000 | 102.6 | 0.5 | 0.4 |
| H : transport. and storage | 200 | 105.6 | 0.5 | –0.4 |
| I : accomodation and food | 98 | 113.8 | 3.8 | 2.6 |
| J : information and comm. | 208 | 92.7 | –0.2 | 0.5 |
| L : real estate activities | 113 | 105.5 | 0.5 | 0.9 |
| M : prof.. scient. and tech. | 167 | 100.4 | –0.2 | 0.2 |
| N : administ. and support | 204 | 105.0 | 0.0 | 0.2 |
| S95 : repair of computers and person. and household goods | 11 | 106.8 | –0.3 | 0.0 |
| Services producer price indices | 2015T02 / 2015T01 | |||
| - services sold to all markets | // | |||
| - services sold to French businesses | // | |||
| - services sold to consumers in France | // | |||
| - export of services | // | |||
- // : unrevised
- How to read it: the variation of indices between the first and the second quarter of 2015 published at the end of August 2015 remained unchanged after the calculations of November 2015.
- Source : INSEE
Documentation
Simplified methodology (pdf,134 Ko)
Pour en savoir plus
Time series : Services producer price indices