

 10 November 2011
2011- n° 274In September 2011, manufacturing output sharply decreased (-1.6%) Industrial production index - September 2011
10 November 2011
2011- n° 274In September 2011, manufacturing output sharply decreased (-1.6%) Industrial production index - September 2011
In September 2011, manufacturing output sharply decreased in volume (-1.6%). It had increased in Au-gust 2011 (+0.6%). In overall industrial production, output decreased as well (-1.7%), as well as in the construction (-5.8%).
In September 2011, manufacturing output sharply decreased in volume (-1.6%). It had increased in August 2011 (+0.6%).
In overall industrial production, output decreased as well (-1.7%), as well as in the construction (-5.8%).
However, in the last three months, manufacturing output increased (+0.5%)…
In the last three months (quarter-on-quarter change), output increased in the manufacturing sector (+0.5%, q o-q) and in the industry as a whole (+0.8%).
Output increased in the electrical, electronic equipment and machine equipment (+2.2%) and was relatively steady in the “other manufacturing” (+0.3%). On the opposite, it decreased in the manufacture of transport equipment (-0.7%).
…and exceeded its last year’s level by 4.2%
Manufacturing output rose by 4.2% (y-o-y).
It strongly increased in the “other manufacturing” (+3.9%), in the electrical and electronic equipment and machine equipment (+7.5%), in the manufacture of food products and beverages (+3.9%) and in the manufacture of transport equipment (+3.6%).
On the other hand, output strongly decreased in the manufacture of coke and refined petroleum products ( 8.6%).
Please note: all the series are adjusted for seasonal variations (SA) and the number of working days (WDA).
graphiqueGraphique1a – Monthly industrial Production indexes
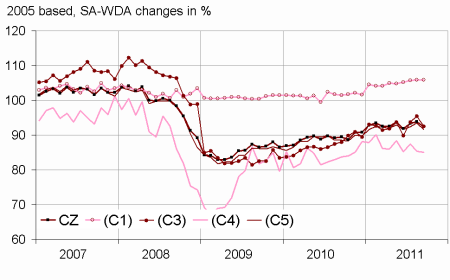
- Legend : CZ : Manufacturing - (C1) : Manufacture of food products and beverages - (C3) : Electrical and electronic equipment; machine equipment - (C4) : Manufacture of transport equipment - (C5) : Other manufacturing
- Sources : Insee, SSP, SOeS
tableauTableau 1 – Variation of the Industrial Production by activity (NA)
| NA : A10, (A17) | Sept. / Aug. | Aug. / July | Quarter on quarter change | Year on year change (1) |
|---|---|---|---|---|
| BE: INDUSTRY | –1,7 | 0,5 | 0,8 | 3,4 |
| CZ: MANUFACTURING | –1,6 | 0,6 | 0,5 | 4,2 |
| (C1): Manufacture of food products and beverages | 0,0 | 0,2 | 0,8 | 3,9 |
| (C2): Manufacture of coke and refined petroleum products | –1,3 | 2,0 | –0,9 | –8,6 |
| (C3): Electrical and electronic equipment; machine equipment | –3,1 | 1,9 | 2,2 | 7,5 |
| (C4): Manufacture of transport equipment | –0,2 | –2,5 | –0,7 | 3,6 |
| (C5): Other manufacturing | –1,9 | 1,1 | 0,3 | 3,9 |
| (DE): Mining and quarrying; energy; water supply; waste management | –2,4 | –0,2 | 2,8 | –1,6 |
| FZ: Construction | –5,8 | 2,1 | –0,4 | 0,1 |
- (1) Last three months / three same months of previous year
- The codes correspond to the level of aggregation A 10 (A 17) of the "NA" aggregate classification based on NAF rev.2.
- Sources : INSEE, SSP, SOeS
In September 2011, output decreased in the « other manufacturing » (-1.9%) …
Output decreased in the manufacture of rubber and plastics products (-3.8%), in the “other manufacturing, repair and installation of machinery and equipment” ( 2.9%), in the manufacture of basic metals and fabricated metal products (-1.5%), in the manufacture of chemicals and chemical products (-2.6%) as well as in the manufacture of wood and paper products; printing and reproduction of recorded media (-3.1%).
On the opposite, output increased in the manufacture of textiles, wearing apparel, leather and related products (+3.7%) and in the manufacture of basic pharmaceutical products and pharmaceutical preparations (+0.6%).
tableauTableau 2 – Variation of the Industrial Production
| NA : A10, (A17), [A38 ou A64] | Sept. 2011 | Sept. / Aug. | Aug. / July | Quarter on quarter change |
|---|---|---|---|---|
| BE: INDUSTRY | 92,8 | –1,7 | 0,5 | 0,8 |
| CZ: MANUFACTURING | 92,4 | –1,6 | 0,6 | 0,5 |
| (C1): Man. of food products and beverages | 105,9 | 0,0 | 0,2 | 0,8 |
| (C2): Man. of coke and refined petroleum products | 74,6 | –1,3 | 2,0 | –0,9 |
| (C3): Electrical and electronic equipment; machine equipment | 92,5 | –3,1 | 1,9 | 2,2 |
| [CI] Man. of computer, electronic and optical products | 93,5 | –2,7 | –2,4 | 1,8 |
| [CJ] Man. of electrical equipment | 101,5 | –1,9 | 1,8 | 0,1 |
| [CK] Man. of machinery and equipment n.e.c. (1) | 86,5 | –4,3 | 5,9 | 4,0 |
| (C4): Man. of transport equipment | 85,1 | –0,2 | –2,5 | –0,7 |
| [CL1] Man. of motor vehicles, trailers and semi-trailers | 68,0 | –7,2 | –0,3 | –0,9 |
| [CL2] Man. of other transport equipment | 119,9 | 9,1 | –5,3 | –0,3 |
| (C5): Other manufacturing | 91,6 | –1,9 | 1,1 | 0,3 |
| [CB] Man. of textiles, wearing apparel, leather and related products | 59,6 | 3,7 | –6,8 | –4,8 |
| [CC] Man. of wood and paper products; printing and reproduction of recorded media | 79,1 | –3,1 | 2,0 | –0,4 |
| [CE] Man. of chemicals and chemical products | 109,7 | –2,6 | 0,2 | –2,6 |
| [CF] Man. of basic pharmaceutical products and pharmaceutical preparations | 119,9 | 0,6 | 0,6 | 2,0 |
| [CG] Man. of rubber and plastics products, and other non-metallic mineral products | 86,7 | –3,8 | 0,9 | –1,7 |
| [CH] Man. of basic metals and fabricated metal products, except machinery and equipment | 83,2 | –1,5 | 1,7 | 1,4 |
| [CM] Other manufacturing; repair and installation of machinery and equipment | 103,5 | –2,9 | 2,6 | 3,4 |
| (DE): Mining and quarrying; energy; water supply; waste management | 95,5 | –2,4 | –0,2 | 2,8 |
| [BZ] Mining and quarrying | 86,7 | –2,9 | 2,4 | 0,9 |
| [DZ] Electricity, gas, steam and air-conditioning supply | 95,5 | –2,9 | –0,6 | 3,6 |
| [EZ] Water supply; sewerage, waste management and remediation | 101,7 | 2,1 | 1,7 | –2,8 |
| FZ: Construction | 88,9 | –5,8 | 2,1 | –0,4 |
| MIGs (2) | ||||
| Capital goods | 86,4 | –2,8 | 1,0 | 1,8 |
| Intermediate goods | 84,9 | –2,2 | 0,9 | –0,3 |
| Consumer durables | 78,4 | –3,8 | 1,7 | 3,0 |
| Consumer non-durables | 105,4 | 0,6 | –0,4 | 0,3 |
- (1) n.e.c. : not elsewhere classifiable
- (2) Main industrial groupings : definition in Commission regulation EC of 14 June 2007
- Sources : Insee, SSP, SOeS
… in the manufacture of electrical and electronic equipment, machine equipment (-3.1%) …
Output strongly decreased in the manufacture of machinery and equipment n.e.c. (-4.3%). It also decreased in the manufacture of computer, electronic and optical products (-2.7%) and in the manufacture of electrical equipment (-1.9%).
… as well as in the manufacture of transport equipment (-0.2%)
Output strongly decreased in the manufacture of motor vehicles, trailers and semi-trailers (-7.2%). On the other hand, it soared in the manufacture of other transport equipment (+9.1%).
Revisions : -0.10 point in August
tableauTableau 3 – Measure of variations’ revisions
| Aug. / July | July / June | June / May | Q2 2011 / Q1 2011 | 2010 / 2009 | |
|---|---|---|---|---|---|
| Industry (BE) | 0,01 | –0,30 | –0,12 | –0,15 | –0,48 |
| raw series | 0,24 | 0,06 | –0,43 | 0,04 | –0,48 |
| SA-WDA coefficient | –0,23 | –0,36 | 0,31 | –0,19 | 0,00 |
| Manufacturing (CZ) | –0,10 | –0,30 | –0,02 | –0,25 | –0,56 |
| raw series | 0,30 | 0,05 | –0,31 | 0,06 | –0,57 |
| SA-WDA coefficient | –0,40 | –0,35 | 0,29 | –0,31 | 0,01 |
- Note of reading : in the manufacturing, the SA-WDA evolution between July and August is revised by -0.10 point : 0.30 is due to the raw series’ revision and -0.40 to the new calculation of the SA-WDA.
- Sources : Insee, SSP, SOeS
In 2010, the revision of the industrial production is mainly due to the new results given by the 2010 Annual Production Survey.
Documentation
Methodology (pdf,163 Ko)