

 13 June 2012
2012- n° 147A slight decrease in enterprise births in May 2012 Enterprise births - May 2012
13 June 2012
2012- n° 147A slight decrease in enterprise births in May 2012 Enterprise births - May 2012
In May 2012, the total number of enterprise births slightly decreased compared to April: -0.9% (seasonally and working-day adjusted data) when the number of self-managed enterprises (raw data) is added (+0.6% for the only enterprise births excluding self-managed enterprises).
Warning : Only enterprise births data excluding self-managed enterprises (SME) are seasonally adjusted. In February 2012, the seasonal adjustment model has been reviewed. In order to get the total of enterprise births, the raw number of SME is added. The SME time series is too short to be properly deseasonalized.
In May 2012, the total number of enterprise births slightly decreased compared to April: +0.6% for the only enterprise births excluding self-managed enterprises (seasonally and working-day adjusted data); -0.9% when the number of self-managed enterprises (raw data) is added.
-3.3% year-on-year (quarterly basis)
The amount of entries, added up March, April and May 2012, decreased compared to the same quarter one year before (-3.3%).
The sectors that most contributed to that decrease were wholesale and retail trade and business support activities.
-4.5% year-on-year (twelve months basis)
During the last twelve months, the number of births decreased by 4.5% year-on-year.
136,614 self-managed enterprises since the beginning of 2012
For the first five months of 2012, one out of every two births enterprises were self-managed enterprises (136,614).
tableautab0EN – Self-managed entreprise births
| Feb. 2012 | March 2012 | April 2012 | May 2012 |
|---|---|---|---|
| 26 842 | 30 179 | 25 893 | 25 357 |
- Source: INSEE (Sirene)
tableautab1EN – Enterprise births by month
| Feb. 2012 | March 2012 | April 2012 | May 2012 | |
|---|---|---|---|---|
| Excl. self-managed enterprises (sa-wda *) | 20 250 | 20 697 | 19 951 | 20 071 |
| Variation [m-o-m] % | -1.8 | 2.2 | -3.6 | 0.6 |
| Incl., in raw data, self-managed enterprises | 47 092 | 50 876 | 45 844 | 45 428 |
| Variation [m-o-m] % | -3.8 | 8.0 | -9.9 | -0.9 |
- * Seasonally and working-day adjusted data
- Source: INSEE (Sirene)
tableautab2EN – Enterprise births by type
| Moving total % change* | Moving total | Moving total | ||
|---|---|---|---|---|
| over 3 months | over 12 months | January- May 2012 | January- May 2011 | |
| Total | -3.3 | -4.5 | 245 754 | 243 965 |
| Companies | -9.1 | -2.4 | 71 000 | 74 334 |
| Individual enterprises | -0.8 | -5.4 | 174 754 | 169 631 |
| Of which self-managed | 4.0 | -3.7 | 136 614 | 126 920 |
- * Total of enterprises births during the last 3 or 12 months compared with the same months a year earlier
- // = meaningless
- Source: INSEE (Sirene)
graphiqueGraph1EN – Enterprise births
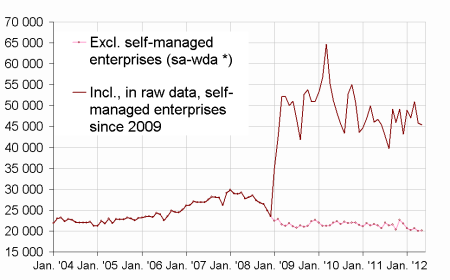
- * Seasonally and working-day adjusted data
- Source: INSEE (Sirene)
Pour en savoir plus
Time series : Business demography