

 9 November 2011
2011- n° 273In manufacturing industry, business managers forecast an increase more moderated
in investment in 2012 : +4% after +11% in 2011 Industrial investment survey - October 2011
9 November 2011
2011- n° 273In manufacturing industry, business managers forecast an increase more moderated
in investment in 2012 : +4% after +11% in 2011 Industrial investment survey - October 2011
Surveyed in October 2011, business managers forecast that investment in manufacturing industry would increase by 11%. They revised 3 points downwards their previous expectations given in July 2011. This revision downwards concern all sectors of manufacturing industry.
- For 2011, expectations of investment were revised downwards
- Industrials confirm the dynamism of investment in H2 2011
- But, the investment revision indicator becomes negative in October
- In 2012, investment would be less dynamic
- In 2012, the purposes of investment would be similar to those in 2011
- According to business leaders, most of supports of investment decisions are less favorable for 2012
For 2011, expectations of investment were revised downwards
Surveyed in October 2011, business managers forecast that investment in manufacturing industry would increase by 11%. They revised 3 points downwards their previous expectations given in July 2011. This revision downwards concern all sectors of manufacturing industry.
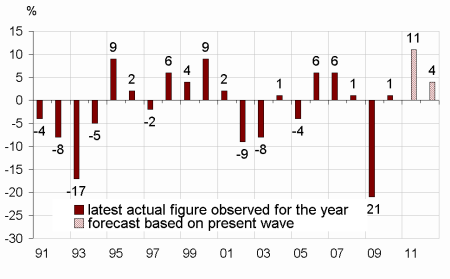
In 2011, the increase of investment would be strong in sectors of other manufacturing (+13%) as manufacture of chemicals and chemical products, manufacture of wood, paper products and printing, manufacture of rubber and plastics products, and other non-metallic mineral product and manufacture of basic metals and fabricated metal products. On the contrary, in sector of motor vehicles investment would decrease by 5%.
graphiqueGraph1_ang – Annual nominal change in investment in manufacturing industry
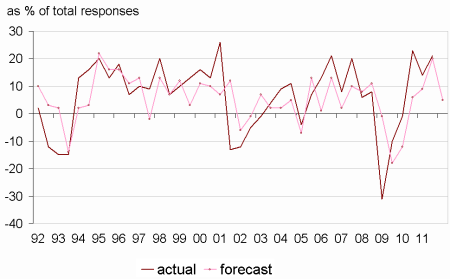
Industrials confirm the dynamism of investment in H2 2011
Between H1 and H2 2011, industrials forecast an increase of their investment, as in last April. Moreover, they forecast that investment would be less dynamic in H1 2012 than in H2 2011.
tableauTab1_ang – Real annual investment growth
| NA* : (A17) et [A38] | In 2011 | In 2012 | |
|---|---|---|---|
| forecast Jul.11 | forecast Oct.11 | forecast Oct.11 | |
| C : MANUFACTURING INDUSTRY | 14 | 11 | 4 |
| (C1): Manufacture of food products and beverages | 11 | 6 | 4 |
| (C3): Electrical and electronic equipment; machine equipment | 10 | 6 | 3 |
| (C4): Manufacture of transport equipment | 7 | 4 | 17 |
| [CL1]: Motor vehicles | 1 | –5 | 25 |
| (C5): Other manufacturing | 16 | 13 | 3 |
- How to read this table: In manufacturing industry, firms surveyed in October 2011 observed a nominal investment increase by 11% in 2011 comparing to 2010 and forecast an increase by 4% in 2012 comparing to 2011.
- * The codes correspond to the level of aggregation (A17) and [A38] of the "NA" aggregate classification based on NAF rev.2.
graphiqueGraph2_ang – Opinion of industrials regarding six-month change in investment (first estimation*)
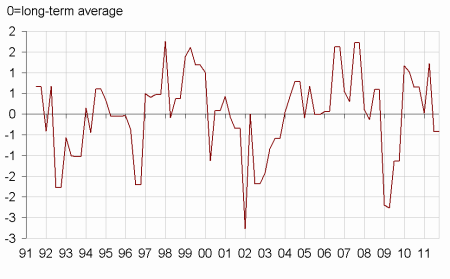
But, the investment revision indicator becomes negative in October
The investment revision indicator becomes negative. Based on investment amounts filled in at each survey by business leaders of manufacturing industry except those of manufacture of food products and beverages (C1) and of coke and refined petroleum products (C2), this indicator is well-correlated with quarterly growth fixed capital formation of non-financial enterprises. That suggest that investment of these enterprises will decrease at the end of 2011.
graphiqueGraphIR_ang – Investment revision indicator
In 2012, investment would be less dynamic
Surveyed for the first time on their investment’s estimate for 2012, business leaders forecast their equipment expenditures would be less dynamic: +4% comparing to 2011. In sector of motor vehicles the rebound in investment would be important : +25%. But at the same time, investment would be less dynamic in sectors of other industries (+3%).
In 2012, the purposes of investment would be similar to those in 2011
According to business leaders in manufacturing industry, the purposes of investment would be similar in 2012 than to 2011. The part of investment purposed to replacement of equipment (28%), to other purposes (22%) as safety, environment, working conditions and to energy savings (9%) would be more important than in long-term average (respectively 26%, 20% and 5%). On the other hand, the part of investments purposed to extension of productive capacity (13%) and automation (7%) would be, as in 2011, lower than in average (respectively 16% and 11%).
tableauTab2_ang – Share of purposes of investment
| Average | 2011 | 2012 | |
|---|---|---|---|
| 1991-2011 | forecast | forecast | |
| Replacement | 26 | 28 | 28 |
| Modernization, streamlining | 24 | 23 | 23 |
| of which : automation | 11 | 8 | 7 |
| of which : new production methods | 7 | 6 | 7 |
| of which : energy savings | 6 | 9 | 9 |
| increase in productive capacity | 16 | 13 | 13 |
| Introduction of new products | 14 | 14 | 14 |
| Other purposes (safety, environment, working conditions…) | 20 | 22 | 22 |
According to business leaders, most of supports of investment decisions are less favorable for 2012
For 2012, business leaders estimate less favorably all the supports of investment, except the expected profits. They expect that demand, interest rates as overall financing conditions would be markedly less favorable: balance of opinion for 2012 are clearly inferior to those for 2011. Moreover, business leaders expect that indebtedness is more unfavorable than usually.
tableauTab3o_ang – Factors influencing investment decisions
| Average | in 2011 | in 2012 | |
|---|---|---|---|
| 1991-2011 | (observation) | (prediction) | |
| Domestic-demand outlook | 51 | 50 | 45 |
| Foreign-demand outlook | 54 | 56 | 52 |
| Expected profits from new investment | 84 | 84 | 84 |
| Cash flow | 15 | 15 | 14 |
| Indebtedness | –4 | –5 | –9 |
| Interest rates | 3 | 4 | 1 |
| Overall financing conditions | 10 | 13 | 10 |
| Technical factors (1) | 63 | 64 | 62 |
| Other factors (such as tax incentives) | 22 | 26 | 25 |
- (1) Technological developments and need for labor to adjust to these new technologies
Documentation
Methodology (pdf,34 Ko)
Pour en savoir plus
Time series : Industry – Investment