

 10 June 2014
2014- n° 132In April 2014, manufacturing output rebounded slightly (+0.3%) Industrial production index - April 2014
10 June 2014
2014- n° 132In April 2014, manufacturing output rebounded slightly (+0.3%) Industrial production index - April 2014
In April 2014, manufacturing output rebounded slightly by 0.3%, after a drop in March (–0.4%). Output increased as well in industrial production as a whole (+0.3%, after –0.4% in March 2014).
In April 2014, manufacturing output rebounded slightly by 0.3%, after a drop in March (–0.4%). Output increased as well in industrial production as a whole (+0.3%, after –0.4% in March 2014).
Manufacturing output of the last three months improved by 0.5% in the quarter…
During the last three months (q-o-q), output improved in the manufacturing sector (+0.5%), but declined in industry as a whole (–0.6%) due to a slump in electricity, gas, steam and air-conditioning.
Output rose in other manufacturing (+0.7%), in the manufacture of transport equipment (+0.6%), in the manufacture of food products and beverages (+0.5%) and, in a more sustained pace, in the manufacture of coke and refined petroleum products (+4.0%). On the other hand, output declined in the manufacture of electrical and electronic equipment; machine equipment (–0.8%).
… and progressed by 1.1% over the year.
Manufacturing output went up by 1.1% (y-o-y).
Output increased in other manufacturing (+1.2%), and soared in the manufacture of transport equipment (+4.3%). It increased more moderately in the manufacture of food products and beverages (+1.0%). On the opposite, output plummeted in the manufacture of coke and refined petroleum products (–8.9%) and diminished in the manufacture of electrical and electronic equipment; machine equipment (–0.7%).
Please note: all the series are adjusted for seasonal variations (SA) and the number of working days (WDA).
graphiqueGraphique1a – Monthly Industrial Production Indices
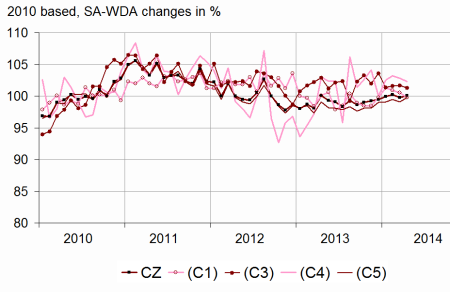
- Legend: CZ: Manufacturing - (C1): Manufacture of food products and beverages - (C3): Electrical and electronic equipment; machine equipment - (C4): Manufacture of transport equipment - (C5): Other manufacturing
- Sources: Insee, SSP, SOeS
tableauTableau1a – Variation of the Industrial Production
| NA : A10, (A17) | April / March | March / Feb. | Q-o-Q change (1) | Year on year change (2) |
|---|---|---|---|---|
| BE: INDUSTRY | 0,3 | –0,4 | –0,6 | –1,0 |
| CZ: Manufacturing | 0,3 | –0,4 | 0,5 | 1,1 |
| (C1): Manufacture of food products and beverages | –0,7 | –0,4 | 0,5 | 1,0 |
| (C2): Manufacture of coke and refined petroleum products | –0,2 | –0,1 | 4,0 | –8,9 |
| (C3): Electrical and electronic equipment; machine equipment | –0,4 | 0,1 | –0,8 | –0,7 |
| (C4): Manufacture of transport equipment | –0,5 | –0,4 | 0,6 | 4,3 |
| (C5): Other manufacturing | 0,7 | –0,4 | 0,7 | 1,2 |
| (DE): Mining and quarrying; energy; water supply; waste management | 0,8 | –0,9 | –5,3 | –9,7 |
| FZ: CONSTRUCTION | 0,2 | –0,1 | –1,0 | 1,7 |
- (1) Last three months / three previous months
- (2) Last three months / three same months of previous year
- The codes correspond to the level of aggregation A 10 (A 17) of the "NA" aggregate classification based on NAF rev.2.
- Sources: INSEE, SSP, SOeS
tableauTableau2a – Variation of the Industrial Production
| NA : A10, (A17), [A38 ou A64] | April 2014 | April / March | March / Feb. | Quarter on quarter change |
|---|---|---|---|---|
| BE: INDUSTRY | 98,5 | 0,3 | –0,4 | –0,6 |
| CZ: Manufacturing | 100,1 | 0,3 | –0,4 | 0,5 |
| (C1): Man. of food products and beverages | 99,8 | –0,7 | –0,4 | 0,5 |
| (C2): Man. of coke and refined petroleum products | 85,0 | –0,2 | –0,1 | 4,0 |
| (C3): Electrical and electronic equipment; machine equipment | 101,3 | –0,4 | 0,1 | –0,8 |
| [CI] Man. of computer, electronic and optical products | 103,8 | –1,2 | –0,1 | –0,1 |
| [CJ] Man. of electrical equipment | 96,2 | 0,5 | 1,4 | –1,2 |
| [CK] Man. of machinery and equipment n.e.c. (1) | 103,0 | –0,4 | –0,4 | –1,0 |
| (C4): Man. of transport equipment | 102,3 | –0,5 | –0,4 | 0,6 |
| [CL1] Man. of motor vehicles, trailers and semi-trailers | 89,5 | –0,2 | –2,3 | –1,2 |
| [CL2] Man. of other transport equipment | 116,6 | –0,9 | 1,4 | 2,1 |
| (C5): Other manufacturing | 99,8 | 0,7 | –0,4 | 0,7 |
| [CB] Man. of textiles, wearing apparel, leather and related products | 102,1 | 6,4 | –0,7 | 2,1 |
| [CC] Man. of wood and paper products; printing and reproduction of recorded media | 88,4 | –1,0 | 0,7 | –0,4 |
| [CE] Man. of chemicals and chemical products | 108,8 | 0,2 | 0,9 | –0,6 |
| [CF] Man. of basic pharmaceutical products and pharmaceutical preparations | 101,0 | 0,1 | 0,1 | 0,4 |
| [CG] Man. of rubber and plastics products, and other non-metallic mineral products | 96,8 | 0,0 | –1,4 | 0,2 |
| [CH] Man. of basic metals and fabricated metal products, except machinery and equipment | 99,5 | 0,7 | –0,7 | 2,1 |
| [CM] Other manufacturing; repair and installation of machinery and equipment | 102,5 | 1,9 | –0,7 | 0,4 |
| (DE): Mining and quarrying; energy; water supply; waste management | 91,9 | 0,8 | –0,9 | –5,3 |
| [BZ] Mining and quarrying | 94,9 | –2,2 | –2,0 | –0,9 |
| [DZ] Electricity, gas, steam and air-conditioning supply | 87,8 | –0,6 | –0,7 | –6,5 |
| [EZ] Water supply; sewerage, waste management and remediation | 118,8 | 9,5 | –2,0 | 0,1 |
| FZ: CONSTRUCTION | 96,7 | 0,2 | –0,1 | –1,0 |
| MIGs (2) | ||||
| Capital goods | 101,9 | 0,3 | –1,2 | 0,2 |
| Intermediate goods | 98,5 | 0,3 | –0,2 | 0,2 |
| Consumer durables | 100,6 | –1,7 | 2,9 | 0,8 |
| Consumer non-durables | 101,2 | 0,1 | 0,3 | 1,0 |
| Energy | 90,9 | 0,8 | –0,8 | –5,0 |
- (1) n.e.c. : not elsewhere classifiable
- (2) Main industrial groupings: definition in Commission regulation EC of June 14th 2007
- Sources: Insee, SSP, SOeS
In April 2014, output went up in other manufacturing (+0.7%)…
The upturn concerned almost all products in other manufacturing. Output went up in other manufacturing; repair and installation of machinery and equipment (+1.9%). It jumped in the manufacture of textiles, wearing apparel, leather and related products (+6.4%). It also improved in the manufacture of basic metals and fabricated metal products, except machinery and equipment products (+0.7%) and very slightly in the manufacture of chemicals and chemical products (+0.2%). It was stable or almost stable in the manufacture of basic pharmaceutical products and pharmaceutical preparations (+0.1%) and in the manufacture of rubber and plastics products, and other non-metallic mineral products. However, it decreased by 1.0% in the manufacture of wood and paper products; printing and reproduction of recorded media.
… but declined in the manufacture of food products and beverages (–0.7%)…
Output weakened by 0.7% in the manufacture of food products and beverages.
… in the manufacture of transport equipment (–0.5%)…
Output dipped in the manufacture of other transport equipment (–0.9%) and, to a lesser extent, in the manufacture of motor vehicles, trailers and semi-trailers (–0.2%).
… as well as in the manufacture of electrical and electronic equipment; machine equipment (–0.4%).
Output decreased in the manufacture of computer, electronic and optical products (–1.2%) and in the manufacture of machinery and equipment n.e.c. (–0.4%), whereas it grew in the manufacture of electrical equipment (+0.5%).
Revisions in March
tableauTableau3a – Measure of variations’ revisions
| March / Feb. | Feb. / Jan. | Jan. / Dec. | Q1 2014 / Q4 2013 | 2013 / 2012 | |
|---|---|---|---|---|---|
| Industry (BE) | 0,30 | 0,00 | –0,20 | –0,10 | –0,03 |
| raw serie | 0,41 | 0,00 | –0,10 | 0,07 | –0,03 |
| SA-WDA coefficient | –0,11 | 0,00 | –0,10 | –0,17 | 0,00 |
| Manufacturing (CZ) | 0,30 | 0,00 | –0,10 | 0,03 | –0,06 |
| raw serie | 0,53 | –0,10 | –0,11 | 0,00 | –0,06 |
| SA-WDA coefficient | –0,23 | 0,10 | 0,01 | 0,03 | 0,00 |
- Note of reading: in the manufacturing sector, the SA-WDA evolution between February 2014 and March 2014 is revised by 0.30 point: 0.53 is due to the raw serie's revision and –0.23 to the new calculation of the SA-WDA.
- Sources: Insee, SSP, SOeS
Documentation
Methodology (pdf,163 Ko)