

 13 February 2013
2013- n° 34In January 2013, oil prices in euro terms rebounded Prices of oil and raw material imports - January 2013
13 February 2013
2013- n° 34In January 2013, oil prices in euro terms rebounded Prices of oil and raw material imports - January 2013
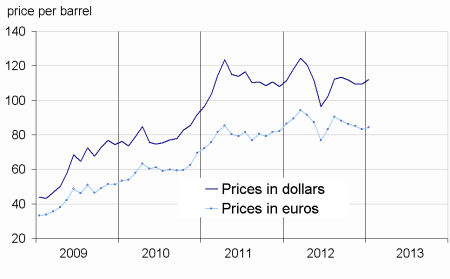
In January, the price of crude oil in euro terms rebounded (+1.2% after –2.2% in December). It stood at €84.3 per barrel of Brent. In euro terms, the prices of commodities except energy imported into France remained stable (+0.0% after +0.4% in December).
In January, the price of crude oil in euro terms rebounded (+1.2% after –2.2% in December). It stood at €84.3 per barrel of Brent. In euro terms, the prices of commodities except energy imported into France remained stable (+0.0% after +0.4% in December).
Oil prices revived
In January, the price of crude oil from the North Sea (Brent) in euro terms recovered (+1.2% after -2.2%). In dollar terms, the price of Brent rose by 2.6% to $112.1 per barrel, but in euro terms, prices benefited from the depreciation of the dollar against the European currency (-1.3%).
Imported industrial raw material prices slowed down
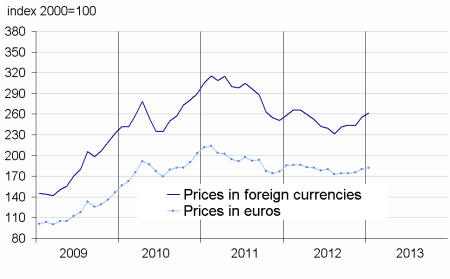
In January, the prices of industrial raw materials in euro terms grew less strongly than in December (+1.0% after +2.8%). On the one hand, mineral raw materials prices moderated (+1.6% after +3.0%). Indeed, non-ferrous metals prices went down (-1.6% after +3.5%), especially those of aluminum (–3.6% after +5.0%), zinc (-1.5% after +4.4%), nickel (-1.0% after +4.5%), and to lesser extend copper (–0.2% after +1.2%). Likewise, precious metals prices went on declining (-2.1% after -3.5%), mainly those of silver (–3.9%) and gold (-2.3%). These drops thus partially offset the marked surge in iron ore prices (+15.3% after +4.7%).
On the other hand, agricultural raw materials prices dipped slightly (-0.5% after +2.0%), with the slowdown of sawn softwood prices (+2.0% after +7.2%) and the decrease in tropical wood prices (–2.4%). Yet, prices of natural rubber expanded further (+4.0% after +1.1%) and those of natural textile fibers were up again (+1.1%).
Raw food materials prices down again
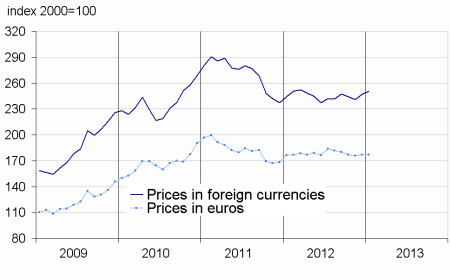
In January, the prices of raw food materials in euro terms fell again (-2.6% after -3.6% in December).
The drop in tropical foodstuff prices continued (-3.9% after -5.1%), notably for cocoa (-7.7%) and tea (–4.8%). Oilseeds prices slipped further (-3.2% after –2.8%), mainly those of soybean meal (-8.4% after –2.3%). Likewise, sugar prices went on decreasing (-3.9% after –2.8%). Finally, cereals prices leveled off (-0.6% after –5.9%) due to a less marked dip in corn prices (-1.9% after –5.1%) and to the stagnation of rice prices (+0.1 after –6.4%).
tableautabpetrole – Oil and petroleum products
| Prices | Change (%) | |||
|---|---|---|---|---|
| of last month | over the last month | over the last 3 months | over the last 12 months | |
| Brent in $ per barrel | 112.1 | 2.6 | 0.3 | 0.5 |
| Brent in € per barrel | 84.3 | 1.2 | –2.2 | –2.5 |
| Gasoline €/L | 0.57 | 3.6 | –6.0 | –1.7 |
| Gas Oil | 721.1 | 2.2 | –4.9 | –2.2 |
| Heavy fuel | 478.5 | 4.0 | –4.1 | –9.1 |
| Naphtha | 701.1 | –2.2 | –4.7 | –4.3 |
- Prices are in euros per ton unless otherwise specified
- Source : INSEE
tableautabmatprem – Imported raw materials (excluding energy) in euros
| Index | Changes (%) | |||
|---|---|---|---|---|
| over the last month | over the last 3 months | over the last 12 months | ||
| Food total | 184.6 | –2.6 | –8.1 | 3.3 |
| Tropical foodstuff | 148.1 | –3.9 | –9.6 | –12.7 |
| Oil seeds. vegetable oils | 237.2 | –3.2 | –9.7 | 24.6 |
| Cereals | 211.5 | –0.6 | –5.3 | 5.2 |
| Sugar | 157.4 | –3.9 | –10.5 | –24.6 |
| Beef meat | 116.5 | 3.2 | –0.2 | –0.3 |
| Industrial raw materials | 182.4 | 1.0 | 4.7 | –1.7 |
| Agricultural raw materials | 111.4 | –0.5 | 6.2 | 5.2 |
| Natural Fibers | 139.7 | 1.1 | 2.7 | –16.7 |
| Natural rubber | 324.6 | 4.0 | 0.5 | –14.5 |
| Hides | 81.7 | –1.2 | 5.8 | 27.5 |
| Wood pulp | 84.4 | 1.0 | 0.3 | –4.6 |
| Tropical wood | 100.1 | –2.4 | –2.7 | –3.7 |
| Sawn softwood | 103.9 | 2.0 | 25.2 | 46.3 |
| Minerals | 221.2 | 1.6 | 4.2 | –3.9 |
| Iron ore | 837.8 | 15.3 | 28.9 | 4.0 |
| Non-ferrous metals | 164.4 | –1.6 | –0.2 | –6.6 |
| Precious metals | 298.9 | –2.1 | –6.0 | –0.6 |
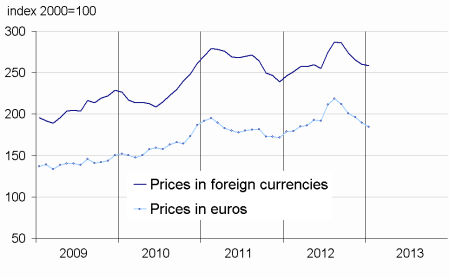
| All commodities | 176.6 | 0.0 | 0.0 | 0.2 |
- Source : INSEE
graphiqueG_petrole_ang – Oil
- Source : INSEE
graphiqueG_alim_ang – Food
- Source : INSEE
graphiqueG_ensemble_ang – All commodities
- Source : INSEE
graphiqueG_indus_ang – Industrial raw materials
- Source : INSEE
Pour en savoir plus
Time series : Raw materials prices