

 12 October 2012
2012- n° 254Increase in enterprise births in September 2012 Enterprise births - September 2012
12 October 2012
2012- n° 254Increase in enterprise births in September 2012 Enterprise births - September 2012
In September 2012, the number of enterprise births increased compared to August: +12.4%. The decrease for enterprise births excluding self-managed enterprises (-3%, seasonally and working-day adjusted data) was compensated by the increase of births self-managed enterprises.
Warning : Only enterprise births data excluding self-managed enterprises (SME) are seasonally adjusted. In February 2012, the seasonal adjustment model has been reviewed. In order to get the total of enterprise births, the raw number of SME is added. The SME time series is too short to be properly deseasonalized.
In September 2012, the number of enterprise births increased compared to August: +12.4%. The decrease for enterprise births excluding self-managed enterprises (-3%, seasonally and working-day adjusted data) was compensated by the increase of births self-managed enterprises.
+0.6% year-on-year (quarterly basis)
The amount of entries added up the third quarter 2012 increased slightly compared to the same quarter one year before (+0.6%).
The sectors that most contributed to that increase were “education; human health and social work activities” and construction.
-1.2% year-on-year (twelve months basis)
During the last twelve months, the number of births decreased by 1.2% year-on-year.
234,720 self-managed enterprises since the beginning of 2012
For the first eight months of 2012, more than one out of two births enterprises were self-managed enterprises (234,720).
tableautab0EN – Self-managed entreprise births
| June 2012 | July 2012 | Aug. 2012 | sept 2012 |
|---|---|---|---|
| 27 096 | 23 859 | 20 869 | 26 597 |
- Source: INSEE (Sirene)
tableautab1EN – Enterprise births by month
| June 2012 | July 2012 | Aug. 2012 | sept 2012 | |
|---|---|---|---|---|
| Excl. self-managed enterprises (sa-wda *) | 20 280 | 20 044 | 20 498 | 19 879 |
| Variation [m-o-m] % | 1.4 | -1.2 | 2.3 | -3.0 |
| Incl., in raw data, self-managed enterprises | 47 376 | 43 903 | 41 367 | 46 476 |
| Variation [m-o-m] % | 4.9 | -7.3 | -5.8 | 12.4 |
- * Seasonally and working-day adjusted data
- Source: INSEE (Sirene)
tableautab2EN – Enterprise births by type
| Moving total % change* | Moving total | Moving total | ||
|---|---|---|---|---|
| over 3 months | over 12 months | January- September 2012 | January- September 2011 | |
| Total | 0.6 | -1.2 | 417 467 | 412 796 |
| Companies | -5.6 | -2.4 | 119 727 | 124 512 |
| Individual enterprises | 3.3 | -0.7 | 297 740 | 288 284 |
| Of which self-managed | 7.2 | 2.0 | 234 720 | 218 210 |
- * Total of enterprises births during the last 3 or 12 months compared with the same months a year earlier
- // = meaningless
- Source: INSEE (Sirene)
graphiqueGraph1EN – Enterprise births
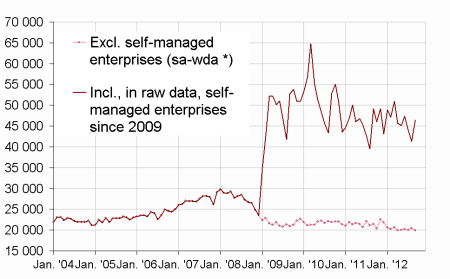
- * Seasonally and working-day adjusted data
- Source: INSEE (Sirene)
Pour en savoir plus
Time series : Business demography