

 25 November 2013
2013- n° 268In November 2013, the business climate improves again in services Monthly survey of services - November 2013
25 November 2013
2013- n° 268In November 2013, the business climate improves again in services Monthly survey of services - November 2013
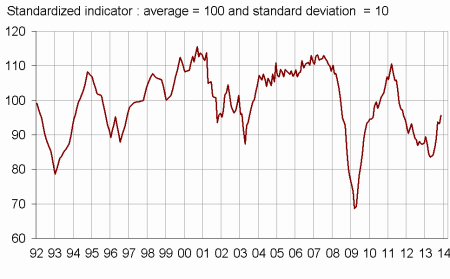
According to business managers, the economic situation in services improves again in November 2013. The business climate composite indicator rises by three points, and reaches 96, still slightly below its long-term average (100). The turning point indicator indicates a favorable economic outlook dynamic.
All services sector
According to business managers, the economic situation in services improves again in November 2013. The business climate composite indicator rises by three points, and reaches 96, still slightly below its long-term average (100). The turning point indicator indicates a favorable economic outlook dynamic.
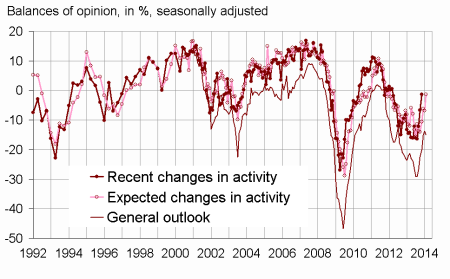
Business managers consider that their activity has recovered in the last few months and more of them anticipate a further upturn. However, their expectations of demand don’t improve. The general outlook is stable and remains below its long-term average.
Employment has improved
In services sector except temporary employment agencies, slightly fewer business managers than in October anticipate a decline in employment over the coming months.
tableauTable_quarter – Economic outlook in the services sector
| Average* | Aug. 13 | Sept. 13 | Oct. 13 | Nov. 13 | |
|---|---|---|---|---|---|
| Composite indicator | 100 | 89 | 94 | 93 | 96 |
| General outlook | –7 | –20 | –15 | –14 | –15 |
| Past activity | 3 | –16 | –12 | –7 | –1 |
| Expected activity | 2 | –11 | –6 | –7 | –1 |
| Expected demand | 0 | –8 | –2 | –2 | –4 |
| Business situation | –2 | –14 | –10 | –11 | –9 |
| Past selling prices | –3 | –11 | –10 | –12 | –13 |
| Expected selling prices | –2 | –10 | –10 | –10 | –7 |
| Past employment | 3 | –7 | –1 | –4 | 2 |
| except temporary work agencies | 1 | –11 | –6 | –7 | –5 |
| Expected employment | 2 | –4 | –1 | 0 | –1 |
| except temporary work agencies | 0 | –7 | –8 | –6 | –4 |
| Investments | |||||
| Past investments | 1 | –5 | –5 | –3 | 1 |
| Expected investments | 1 | –1 | 1 | 0 | –2 |
- * Average of the balances of opinion since 1988
- Source: Insee
graphiqueGraph1 – Composite indicator
graphiquegraph_retourn – Turning point indicator
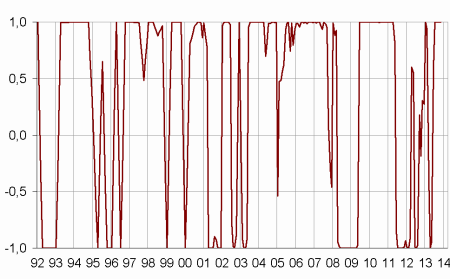
- Note: close to 1 (respectively -1), this indicator indicates a favorable short-term economic situation (respectively unfavorable).
graphiqueGraph2 – Activity
Road transport
In road freight and mail activities, business managers assess that activity has recovered in the recent period.
According to them, this improvement will continue in the coming months.
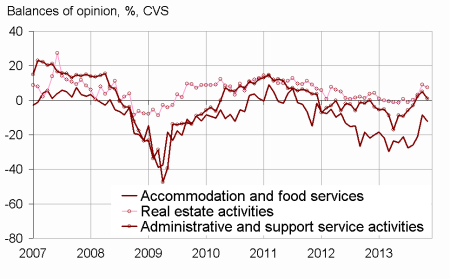
Accommodation and food service activities
In accommodation and food service activities, fewer business managers than in October believe that activity has deteriorated in the recent months. However, their business expectations and demand are deteriorating.
Information and communication
In information and communication, the balance of opinion on past activity has increased over the last few months. Less business managers anticipate a decline of activity for the next three months.
Real estate activities
In real estate activities, the balance of opinion on past activity is almost stable. Business managers’ expectations of activity and demand are less optimistic than in October.
Professional, scientific and technical activities
In professional, scientific and technical activities, business managers consider that activity has remained lackluster in recent months. Their demand expectations are pessimistic.
Administrative and support service activities
In administrative and support service activities, business managers indicate that activity and employment have rebounded in the recent period. They revise their forecasts of activity and recruitment downward for the next few months.
graphiquegraph_bonus_ – Expected activity
tableauTable_det – Detailed data
| A21 | Average* | Aug. 13 | Sept. 13 | Oct. 13 | Nov. 13 |
|---|---|---|---|---|---|
| (H) Road transport | |||||
| Past activity | –8 | –21 | –19 | –8 | –5 |
| Expected activity | –9 | –21 | –10 | –4 | 3 |
| Expected demand | –13 | –21 | –13 | –7 | –8 |
| Past employment | –8 | –8 | –11 | –6 | –5 |
| Expected employment | –11 | –15 | –11 | –6 | –4 |
| (I) Accommodation and food service activities | |||||
| Past activity | –7 | –21 | –19 | –19 | –13 |
| Expected activity | –7 | –26 | –21 | –8 | –12 |
| Expected demand | –9 | –27 | –14 | –8 | –13 |
| Past employment | –4 | –22 | –11 | –14 | –14 |
| Expected employment | –5 | –17 | –13 | –11 | –9 |
| (J) Information and communication | |||||
| Past activity | 10 | –33 | –28 | –10 | 0 |
| Expected activity | 12 | –12 | –3 | –21 | –1 |
| Expected demand | 12 | 0 | 11 | 5 | 7 |
| Past employment | 7 | –11 | –16 | –9 | –5 |
| Expected employment | 12 | –7 | –5 | 1 | 3 |
| (L) Real estate activities | |||||
| Past activity | 7 | 2 | 4 | 0 | –1 |
| Expected activity | 8 | 0 | 3 | 9 | 7 |
| Expected demand | 2 | –4 | 0 | 2 | –3 |
| Past employment | 3 | –5 | –1 | –5 | 0 |
| Expected employment | 2 | 1 | –5 | –2 | 2 |
| (M) Professional, scientific and technical activities | |||||
| Past activity | –1 | –13 | –9 | –3 | –5 |
| Expected activity | –2 | –9 | –11 | –11 | –9 |
| Expected demand | –5 | –13 | –12 | –10 | –13 |
| Past employment | 1 | –6 | –6 | –6 | 0 |
| Expected employment | 0 | –5 | –7 | –5 | –5 |
| (N) Administrative and support service activities | |||||
| Past activity | 6 | –8 | –3 | 1 | 8 |
| Expected activity | 5 | –3 | 2 | 5 | 1 |
| Expected demand | 3 | 3 | 1 | 0 | –3 |
| Past employment | 8 | 1 | 13 | 2 | 24 |
| Expected employment | 6 | 8 | 13 | 10 | 5 |
- * Average of the balances of opinion since 1988 (2006 for road transport)
Documentation
Methodology (2016) (pdf,158 Ko)
Pour en savoir plus
Time series : Economic outlook surveys – Services