

 13 March 2013
2013- n° 60In February 2013, further increase in oil prices Prices of oil and raw material imports - February 2013
13 March 2013
2013- n° 60In February 2013, further increase in oil prices Prices of oil and raw material imports - February 2013
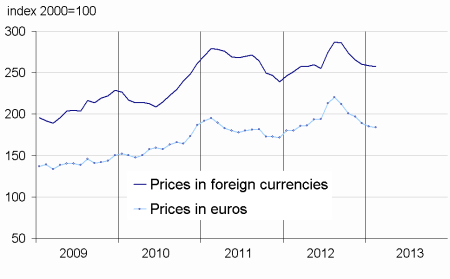
In February, the price of crude oil in euro terms continued to grow (+3.4% after +1.2% in January), reaching €84.3 per barrel of Brent. In euro terms, the prices of commodities except energy imported into France remained stable (+0.1% after -0.2% in January).
In February, the price of crude oil in euro terms continued to grow (+3.4% after +1.2% in January), reaching €84.3 per barrel of Brent. In euro terms, the prices of commodities except energy imported into France remained stable (+0.1% after -0.2% in January).
Oil prices accelerated
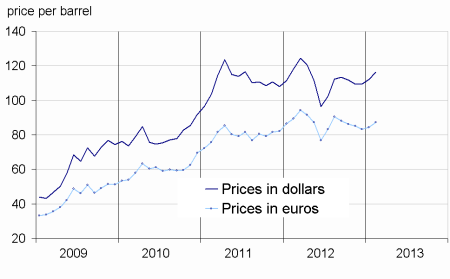
In February, the price of crude oil from the North Sea (Brent) in euro terms rose again (+3.4% after +1.2%). In dollar terms, the price increase was a little more marked (+3.8% after +2.6%), due to a further depreciation of the dollar against the European currency (-0.4%). Oil prices stood at $116.4 per barrel of Brent.
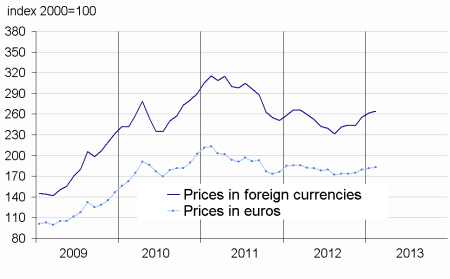
Imported industrial raw material prices slowed down
In February, the increase in prices of industrial raw materials in euro terms moderated (+0.5% after +1.0%). On the one hand, mineral raw materials prices grew less sharply than in January (+0.7% after +1.4%). Precious metals prices went on declining (-1.8% after –1.9%), especially those of gold (-3.0%) and silver (-2.9%). Meanwhile, iron ore prices significantly slowed down (+2.3% after +15.3%). By contrast, non-ferrous metals prices picked up slightly (+0.6% after –1.6%), driven by the increase in the prices of nickel (+1.1%), zinc (+4.1%) and to lesser extent aluminum (+0.3%). Copper prices, however, dipped again (-0.2%).
On the other hand, agricultural raw materials prices slipped (-0.1% after +0.3%). Indeed, the prices of sawn softwood (-0.9%), tropical wood (-3.6%) and natural rubber (-0.5%) declined. Natural textile fibers prices, however, firmed up (+3.9% after +1.3%), due to the strenghthening of cotton prices (+4.5% after +1.5% ).
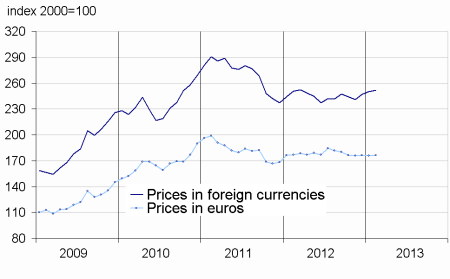
The drop in raw food materials prices moderated
In February, the prices of raw food materials in euro terms fell less sharply than in January (-0.7% after -2.2%).
Tropical foodstuff prices went on decreasing (-3.1% after –3.9%), notably those of arabica (–6.4%), cocoa (-3.4%) and tea (–5.7%). Sugar prices (-3.0%) and beef prices (-1.7%) were lower too. The drop in cereals prices continued (-0.7% after –0.5%), mainly for corn (–1.4%). Oilseeds prices, however, rebounded (+1.6% after –3.6%), notably those of soybean meal (+1.5% after –7.4%) and soybean (+1.9 after –2.8%), in the wake of a deteriorating outlook for the soybean crop in Argentina, due to insufficient rains.
tableautabpetrole – Oil and petroleum products
| Prices | Change (%) | |||
|---|---|---|---|---|
| of last month | over the last month | over the last 3 months | over the last 12 months | |
| Brent in $ per barrel | 116.4 | 3.8 | 6.5 | –1.6 |
| Brent in € per barrel | 87.2 | 3.4 | 2.3 | –2.4 |
| Gasoline €/L | 0.604 | 6.4 | 3.3 | 0.2 |
| Gas Oil | 746.4 | 3.5 | 2.3 | –1.7 |
| Heavy fuel | 499.5 | 4.4 | 5.0 | –8.1 |
| Naphtha | 737.9 | 5.2 | 1.7 | –4.8 |
- Prices are in euros per tonne unless otherwise specified
- Source : INSEE
tableautabmatprem – Imported raw materials (excluding energy) in euros
| Index | Changes (%) | |||
|---|---|---|---|---|
| over the last month | over the last 3 months | over the last 12 months | ||
| Food total | 183.7 | –0.7 | –6.7 | 2.0 |
| Tropical foodstuff | 143.4 | –3.1 | –11.6 | –13.2 |
| Oil seeds. vegetable oils | 238.8 | 1.6 | –5.6 | 20.9 |
| Cereals | 210.2 | –0.7 | –7.1 | 5.9 |
| Sugar | 152.8 | –3.0 | –9.3 | –27.4 |
| Beef meat | 114.4 | –1.7 | –0.6 | –3.6 |
| Industrial raw materials | 182.7 | 0.5 | 4.4 | –1.7 |
| Agricultural raw materials | 111.0 | –0.1 | 2.2 | 5.5 |
| Natural Fibers | 128.8 | 3.9 | 6.4 | –11.8 |
| Natural rubber | 322.9 | –0.5 | 4.6 | –19.2 |
| Hides | 85.8 | 5.1 | 8.4 | 25.0 |
| Wood pulp | 84.8 | 0.5 | –0.7 | –1.3 |
| Tropical wood | 96.5 | –3.6 | –6.9 | –5.6 |
| Sawn softwood | 103.0 | –0.9 | 8.3 | 43.0 |
| Minerals | 222.4 | 0.7 | 5.2 | –3.9 |
| Iron ore | 857.4 | 2.3 | 23.5 | 9.2 |
| Non-ferrous metals | 165.3 | 0.6 | 2.4 | –6.9 |
| Precious metals | 294.2 | –1.8 | –6.9 | –6.9 |
| All commodities | 176.1 | 0.1 | 0.2 | –0.5 |
- Source : INSEE
graphiqueG_petrole_ang – Oil
- Source : INSEE
graphiqueG_alim_ang – Food
- Source : INSEE
graphiqueG_ensemble_ang – All commodities
- Source : INSEE
graphiqueG_indus_ang – Industrial raw materials
- Source : INSEE
Pour en savoir plus
Time series : Raw materials prices