

 23 January 2013
2013- n° 20In January 2013, the economic climate in services improves very slightly Monthly survey of services - January 2013
23 January 2013
2013- n° 20In January 2013, the economic climate in services improves very slightly Monthly survey of services - January 2013
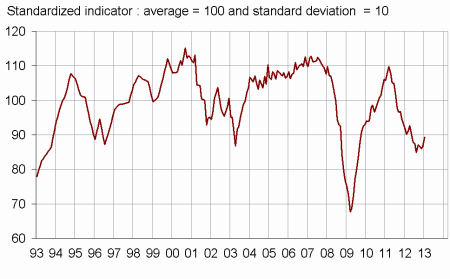
According to the business leaders surveyed in January 2013, the economic situation in services remained deteriorated. The business climate synthetic indicator rose by two points in January, and is 89, still below its long-term average (100). The general outlook stayed also well below its long-term average.
According to the business leaders surveyed in January 2013, the economic situation in services remained deteriorated. The business climate synthetic indicator rose by two points in January, and is 89, still below its long-term average (100). The general outlook stayed also well below its long-term average.
If business leaders consider that their activity deteriorated in the last few months, they are less pessimistic in their expectations of activity for the coming months.
Business leaders consider that their operating balance result was less damaged over the last few months and less of them anticipate a decline in the coming months.
The turning point is in a favorable area.
Employment remains degraded
In services except temporary employment agencies, less business leaders than in december reported a decline in employement over the recent period. They remain pessimistic in their expectations for recruitment.
graphiqueGraph1 – Business climate synthetic indicator
graphiquegraph_retourn – Turning point indicator
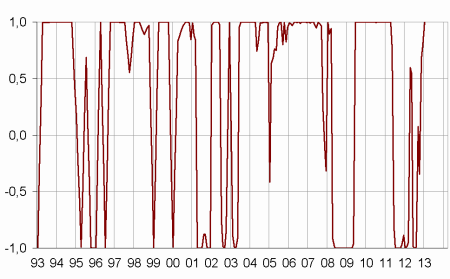
- Note: close to 1 (respectively -1), this indicator indicates a favourable short-term economic situation (respectively unfavourable).
tableauTable_quarter – Economic outlook in the services sector
| Average* | Oct. 12 | Nov. 12 | Dec. 12 | Jan. 13 | |
|---|---|---|---|---|---|
| Business climate synthetic indicator | 100 | 87 | 86 | 87 | 89 |
| General outlook | –6 | –24 | –22 | –21 | –22 |
| Past activity | 3 | –12 | –9 | –8 | –15 |
| Expected activity | 3 | –6 | –12 | –12 | –6 |
| Expected demand | 1 | –12 | –13 | –12 | –11 |
| Business situation | –1 | –16 | –15 | –15 | –16 |
| Past selling prices | –3 | –9 | –10 | –9 | –12 |
| Expected selling prices | –1 | –11 | –9 | –9 | –10 |
| Past employment | 3 | –13 | –8 | –7 | –6 |
| except temporary work agencies | 1 | –9 | –6 | –5 | –2 |
| Expected employment | 2 | –6 | –7 | –9 | –10 |
| except temporary work agencies | 0 | –6 | –8 | –9 | –9 |
| Investments | |||||
| Past investments | 2 | –5 | –6 | 1 | 1 |
| Expected investments | 1 | –4 | 0 | 1 | –5 |
| Operating balance result | |||||
| Past result | –1 | –16 | –9 | ||
| Expected result | –1 | –16 | –9 | ||
| Cash position | –10 | –13 | –17 | ||
| Difficulties of supply and demand | |||||
| difficulties of supply and demand | 10 | 11 | 12 | ||
| difficulties of supply only | 23 | 18 | 19 | ||
| difficulties of demand only | 30 | 41 | 36 | ||
| Difficulties in recruitment | 30 | 19 | 21 |
- * Average of the balances of opinion since 1988
- Source: Insee
Documentation
Methodology (2016) (pdf,158 Ko)
Pour en savoir plus
Time series : Economic outlook surveys – Services