

 30 July 2014
2014- n° 177In May 2014, the turnover in manufacturing industry dropped compared to April (–1.4%) Turnover in industry and construction - May 2014
30 July 2014
2014- n° 177In May 2014, the turnover in manufacturing industry dropped compared to April (–1.4%) Turnover in industry and construction - May 2014
In May 2014, the turnover fell sharply in the manufacturing industry (–1.4%) after a slight decrease in April (–0.2%). Exports plunged even more (–3.0%). The turnover dropped in the industry as a whole (–1.1%).

Every index in this issue is in value, seasonally and working day adjusted. Bridging days (Fridays 2nd, 9th and 30th May) were considered like normal working days for SA-WDA treatment. The commentary shows variations of subsections by decreasing contribution. The contribution of a subsection depends on the extent of the change and on its weight.
In May 2014, the turnover fell sharply in the manufacturing industry (–1.4%) after a slight decrease in April (–0.2%). Exports plunged even more (–3.0%).
The turnover dropped in the industry as a whole (–1.1%).
Decline over the last three months (–0.7%)…
Over the quarter (q-o-q), the turnover dipped in the manufacturing industry (–0.7%) as in the industry as a whole (–1.1%).
The turnover went down in other manufacturing (–1.1%), mainly in the manufacture of basic metals and fabricated metal products (–1.7%) and in the manufacture of chemicals and chemical products (–1.8%). It dropped in the manufacture of coke and refined petroleum products (–3.9%) and in the electrical and electronic equipment; machine equipment (–1.3%). Conversely, it grew in the manufacture of transport equipment (+1.4%) owed to a sharp rise in the manufacture of other transport equipment (+4.3%). It stabilized in the manufacture of food products and beverages (0.0%).
…and over the last year (–0.5%)
Year-on-year, the turnover declined in the manufacturing industry (–0.5%).
Over this period, the turnover dipped in the manufacture of coke and refined petroleum products (–4.2%) and in the electrical and electronic equipment; machine equipment (–1.8%); it fell slightly in other manufacturing (–0.3%). On the contrary, it rose in the manufacture of food products and beverages (+0.6%) and, slightly, in the manufacture of transport equipment (+0.2%).
graphiqueIRgraph3 – Turnover in manufacturing industry
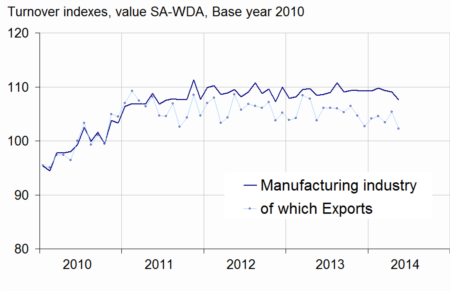
- Source: INSEE
graphiqueIRGraph4 – Turnover in manufacturing industry by sector
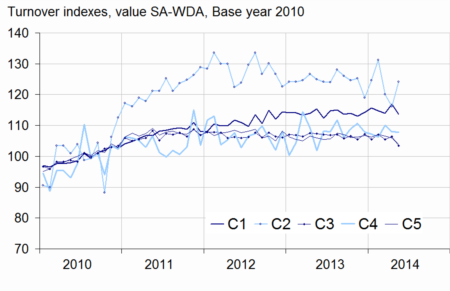
- Source: INSEE
tableauIRtab5 – Variation of the turnover in industry and construction
| Change in % | |||||
|---|---|---|---|---|---|
| Nace classification | Weight** | May/ Apr. | Apr./ Mar. | q-o-q (1) | y-o-y (2) |
| BE: INDUSTRY | 10000 | –1.1 | –0.2 | –1.1 | –1.1 |
| CZ: MANUFACTURING | 8373 | –1.4 | –0.2 | –0.7 | –0.5 |
| Of which Exports | 2731 | –3.0 | 1.9 | –0.1 | –2.8 |
| (C1): Manufacture of food products and beverages | 1647 | –2.7 | 2.5 | 0.0 | 0.6 |
| (C2): Manufacture of coke and refined petroleum products | 478 | 7.0 | –3.3 | –3.9 | –4.2 |
| (C3): Electrical and electronic equipment; machine equipment | 1005 | –2.7 | 0.9 | –1.3 | –1.8 |
| (C4): Manufacture of transport equipment | 1428 | –0.2 | –1.9 | 1.4 | 0.2 |
| (C5): Other manufacturing | 3815 | –2.0 | –0.6 | –1.1 | –0.3 |
| DE: Mining and quarrying; energy; water supply; waste management | 1627 | 0.1 | –0.3 | –3.7 | –4.5 |
| FZ: CONSTRUCTION | 10000 | –0.5 | 0.3 | 0.4 | 1.5 |
- ** 10000=B...E and F
- (1) Quarter-on-quarter: last three months / previous three months
- (2) Year-on-year: last three months / same three months of the previous year
- The codes correspond to different levels of aggregation of the NACE classification.
- Source: INSEE
In May 2014, the turnover fell sharply in other manufacturing (–2.0%)
In May, the turnover decreased notably in other manufacturing for the third month in a row (–2.0%, after –0.6% in April and –0.5% in March). It declined in all sectors, mainly in the manufacture of rubber and plastic products, and other non-mineral products (–3.5%), in the manufacture of basic metals and fabricated metal products (–1.8%) and in the manufacture of chemicals and chemical products (–1.9%).
Considerable fall in food products (–2.7%)…
In May, the turnover plummeted in the manufacture of food products and beverages (–2.7%) after a substantial rise in April (+2.5%).
…and in equipment (–2.7%)
The turnover went down considerably in the electrical and electronic equipment; machine equipment (–2.7%), after a growth in April (+0.9%). It plunged in the manufacture of computer, electronic and optical products (–5.1%) and in the manufacture of electrical equipment (–3.2%). It dropped in the manufacture of machinery and equipment n.e.c. (–1.2%).
Slight fall in transport equipment (–0.2%)
The turnover went down slightly in the manufacture of transport equipment (–0.2%) after a sharp decrease in April (–1.9%). It declined significantly in the manufacture of motor vehicles, trailers and semi-trailers (–2.0%). Conversely, it climbed in the manufacture of other transport equipment (+1.1%). Exports fell dramatically (–3.4%).
Rebound in coke and refined petroleum products (+7.0%)
The turnover recovered dramatically in the manufacture of coke and refined petroleum products (+7.0%) after a two-month-in-a-row fall.
Revisions: –0.3 point in April
In the manufacturing industry, the change of the turnover is revised at –0.2%, instead of +0.1% calculated previously.
tableauIRtab8 – Indexes of turnover in industry and construction
| Change in % | |||||
|---|---|---|---|---|---|
| Nace classification | Weight* | May 2014 | May/ Apr. | Apr./ Mar. | q-o-q (1) |
| BE: INDUSTRY | 10000 | 107.5 | –1.1 | –0.2 | –1.1 |
| CZ: MANUFACTURING | 8373 | 107.6 | –1.4 | –0.2 | –0.7 |
| of which Exports | 2731 | 102.2 | –3.0 | 1.9 | –0.1 |
| (C1): Man. of food products and beverages | 1647 | 113.7 | –2.7 | 2.5 | 0.0 |
| of which Exports | 284 | 116.1 | –5.9 | 3.8 | –1.0 |
| (C2): Man. of coke and refined petroleum products | 478 | 124.2 | 7.0 | –3.3 | –3.9 |
| (C3): Electrical and electronic equipment; machine equipment | 1005 | 103.5 | –2.7 | 0.9 | –1.3 |
| of which Exports | 483 | 100.7 | –3.5 | –1.2 | 1.3 |
| [CI] Man. of computer, electronic and optical products | 269 | 97.4 | –5.1 | 6.7 | –2.1 |
| [CJ] Man. of electrical equipment | 302 | 98.1 | –3.2 | –2.9 | –0.7 |
| [CK] Man. of machinery and equipment n.e.c. | 434 | 111.1 | –1.2 | 0.2 | –1.3 |
| (C4): Man. of transport equipment | 1428 | 107.8 | –0.2 | –1.9 | 1.4 |
| of which Exports | 693 | 92.8 | –3.4 | 9.0 | –1.0 |
| [CL1] Man. of motor vehicles, trailers and semi-trailers | 689 | 89.6 | –2.0 | –0.4 | –2.4 |
| [CL2] Man. of other transport equipment | 739 | 124.8 | 1.1 | –2.9 | 4.3 |
| (C5): Other manufacturing | 3815 | 103.9 | –2.0 | –0.6 | –1.1 |
| of which Exports | 1213 | 103.7 | –2.4 | –0.6 | –0.3 |
| [CB] Man. of textiles, wearing apparel, leather and related products | 191 | 109.2 | –1.1 | 0.0 | 0.2 |
| [CC] Man. of wood and paper products; printing and reproduction of recorded media | 427 | 99.8 | –1.4 | –0.5 | –1.1 |
| [CE] Man. of chemicals and chemical products | 706 | 104.4 | –1.9 | –0.4 | –1.8 |
| [CF] Man. of basic pharmaceutical products and pharmaceutical preparations | 322 | 98.5 | –2.5 | 0.3 | 1.9 |
| [CG] Man. of rubber and plastics products, and other non-metallic mineral products | 620 | 101.2 | –3.5 | –0.8 | –1.8 |
| [CH] Man. of basic metals and fabricated metal products, except machinery and equipment | 900 | 103.2 | –1.8 | –0.6 | –1.7 |
| [CM] Other manufacturing; repair and installation of machinery and equipment | 649 | 110.9 | –1.4 | –0.9 | –0.7 |
| DE: Mining and quarrying; energy, water supply, sewerage, waste management | 1627 | 106.5 | 0.1 | –0.3 | –3.7 |
| [BZ] Mining and quarrying | 69 | 104.2 | –3.1 | 0.3 | –2.3 |
| [DZ] Electricity, gas, steam and air-conditioning supply | 1216 | 107.9 | 0.6 | –0.7 | –4.1 |
| [EZ] Water supply; sewerage, waste management and remediation | 342 | 102.2 | –0.8 | 1.3 | –2.3 |
| FZ: CONSTRUCTION | 10000 | 106.6 | –0.5 | 0.3 | 0.4 |
- ** 10000=B...E and F
- (1) Quarter-on-quarter: last three months / previous three months
- Source: INSEE
tableauIRtab7 – Measure of variations' revisions
| Apr./ Mar. | Mar./ Feb. | Feb./ Jan. | Q1 2014/ Q4 2013 | 2013/ 2012 | |
|---|---|---|---|---|---|
| Industry (BE) | –0.46 | 0.00 | –0.09 | –0.12 | –0.02 |
| raw serie | –0.27 | 0.00 | 0.00 | 0.00 | 0.00 |
| SA-WDA coeff. | –0.19 | 0.00 | –0.09 | –0.12 | –0.02 |
| Manufacturing industry (CZ) | –0.27 | –0.09 | –0.09 | –0.18 | –0.04 |
| raw serie | 0.00 | –0.20 | 0.10 | 0.00 | 0.00 |
| SA-WDA coeff. | –0.27 | 0.11 | –0.19 | –0.18 | –0.04 |
- Foot note: in the manufacturing industry, the SA-WDA change between March and April 2014 is revised by –0.27 point, owed to the recalculation of the SA-WDA coefficients.
- Source: INSEE
Documentation
Methodology (pdf,140 Ko)
Pour en savoir plus
Time series : Turnover indices (VAT)