

 16 April 2014
2014- n° 88In March 2014, oil prices weakened Prices of oil and raw material imports - March 2014
16 April 2014
2014- n° 88In March 2014, oil prices weakened Prices of oil and raw material imports - March 2014
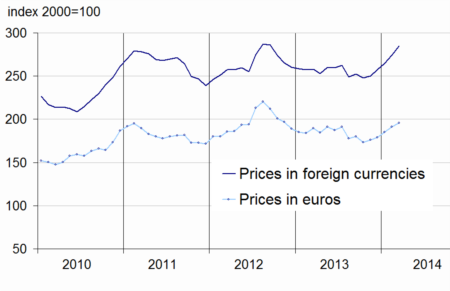
In March, the price of crude oil in euro terms decreased (–2.0%) and stood at €77.9 per barrel of Brent. Prices of imported commodities except energy in euros went down as well (-0.5%), because prices of industrial raw materials and minerals were on the downside (-2.7% and -3.4% respectively).
In March, the price of crude oil in euro terms decreased (–2.0%) and stood at €77.9 per barrel of Brent. Prices of imported commodities except energy in euros went down as well (-0.5%), because prices of industrial raw materials and minerals were on the downside (-2.7% and -3.4% respectively).
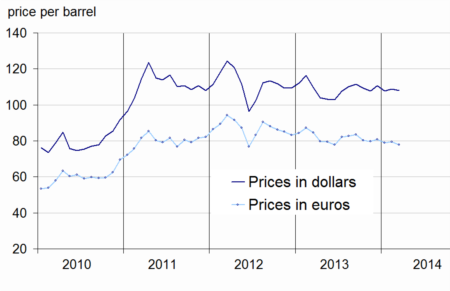
Oil prices in euros dropped
In March, the price of crude oil from the North Sea (Brent) in dollars declined (-0.7% after +1.0%), as a result of a higher supply, especially from Opec countries. In euros, the Brent price decrease was more significant (-2.0% after +0.6%), because the euro appreciated against the dollar once again (+1.2%) in March.
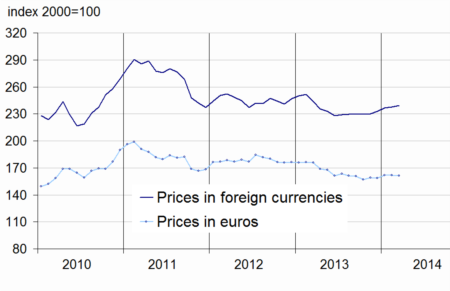
Industrial raw materials prices dipped
In March, prices of industrial raw materials in euros went down again (-2.7% after -2.0% in February). Prices of agricultural raw materials declined, though less markedly (–0.9% from -2.3%), in particular those of sawn sofwood (–1.6% after -2.8%).
Prices of Minerals decreased as well (-3.4% after -1.9%) because of the repeated drop in Iron ore prices (-9.0% after –5.6%), due to a weaker steel demand in China. On the whole, prices of Non-ferrous metals came down (–2.2% after -1.3%), except for nickel (+9.0% from +0.5%), because market participants feared supply disruptions, should the tensions between the western economies and Moscow strengthen. In effect, Russia and Ukraine amount to 17% of the world’s refined nickel supply. That decline was partly offset by higher prices of Precious metals (+0.9% after +2.7%), especially those of palladium (+5.1% after –1.2%), of which Russia is the world’s first exporting country. Prices of platinum also recovered (+1.7% after –1.2%).
Rise in raw food materials prices
In March, prices of raw food materials in euros increased again (+2.6% after +3.7%). Prices of arabica softened slightly (+21.3% after +30.0%), because coming rain falls may exert downward pressure on markets. Beef meat prices rose sharply (+8.4% after –4.3%), because dry periods affected the bovine livestock population growth in the United States and Australia, the latter being the world’s third producing country.
tableautabpetrole – Oil and petroleum products
| Prices | Change (%) | |||
|---|---|---|---|---|
| of last month | over the last month | over the last 3 months | over the last 12 months | |
| Brent in $ per barrel | 107,9 | –0,7 | –2,5 | –1,6 |
| Brent in € per barrel | 77,9 | –2,0 | –3,5 | –7,9 |
| Gasoline €/L | 0,52 | 1,6 | 9,5 | –11,4 |
| Gas Oil | 652,0 | –3,2 | –4,8 | –7,6 |
| Heavy fuel | 462,8 | 1,4 | 4,4 | –3,4 |
| Naphtha | 657,3 | –1,7 | –5,7 | –6,3 |
- Prices are in euros per tonne unless otherwise specified
- Source : INSEE
tableautabmatprem – Imported raw materials (excluding energy) in euros
| Index | Changes (%) | |||
|---|---|---|---|---|
| over the last month | over the last 3 months | over the last 12 months | ||
| Food total | 196,0 | 2,6 | 9,6 | 3,3 |
| Tropical foodstuffs | 174,3 | 4,2 | 17,5 | 19,8 |
| Oil seeds, vegetable oils | 239,7 | –1,4 | 1,6 | –1,1 |
| Cereals | 147,5 | –0,1 | 1,1 | –31,8 |
| Sugar | 142,3 | 6,9 | 6,2 | –10,1 |
| Beef meat | 142,8 | 8,4 | 21,9 | 13,7 |
| Industrial raw materials | 151,5 | –2,7 | –3,5 | –15,3 |
| Agricultural raw materials | 105,4 | –0,9 | –0,5 | –8,2 |
| Natural Fibers | 130,1 | 1,1 | 7,6 | –6,1 |
| Natural rubber | 198,0 | –0,4 | –17,6 | –35,5 |
| Hides | 91,8 | 2,1 | 4,0 | 8,9 |
| Wood pulp | 90,2 | –0,7 | 0,7 | 3,3 |
| Tropical wood | 100,1 | –0,8 | 0,5 | 3,1 |
| Sawn softwood | 94,7 | –1,6 | –1,4 | –15,7 |
| Minerals | 176,1 | –3,4 | –4,6 | –17,7 |
| Iron ore | 598,2 | –9,0 | –18,4 | –25,2 |
| Non-ferrous metals | 135,6 | –2,2 | –1,8 | –15,1 |
| Precious metals | 228,1 | 0,9 | 7,4 | –22,1 |
| All commodities | 161,2 | –0,5 | 1,7 | –8,3 |
- Source : INSEE
graphiqueG_petrole_ang – Oil
- Source : Insee
graphiqueG_alim_ang – Food
- Source : Insee
graphiqueG_ensemble_ang – All commodities
- Source : Insee
graphiqueG_indus_ang – Industrial raw materials

- Source : Insee
Pour en savoir plus
Time series : Raw materials prices