

 29 October 2013
2013- n° 250In August 2013, the turnover in manufacturing industry improved by 1.8% compared
to July Turnover in industry and construction - August 2013
29 October 2013
2013- n° 250In August 2013, the turnover in manufacturing industry improved by 1.8% compared
to July Turnover in industry and construction - August 2013
In August 2013, the turnover rose sharply in the manufacturing industry (+1.8%). Exports levelled off (+0.1%). The turnover increased significantly in the industry as a whole (+1.7%).
In August 2013, the turnover rose sharply in the manufacturing industry (+1.8%). Exports levelled off (+0.1%).
The turnover increased significantly in the industry as a whole (+1.7%).
A sluggish growth over the last three months (+0.2%)…
Over the quarter (q-o-q), the turnover went up slightly in the manufacturing industry (+0.2%). It increased in other industries (+0.3%), in the manufacture of coke and refined petroleum (+0.9%), in the manufacture of transport equipments (+0.4%) and in the electrical and electronic equipment; machine equipment (+0.2%). Conversely, it declined in the manufacture of food products and beverages (–0.3%).
…and a stability over the last year (+0.1%)
Year-on-year, the turnover remained stable in the manufacturing industry (+0.1%). On the one hand, it grew sharply in the manufacture of transport equipments (+3.5%), in the manufacture of food products and beverages (+2.4%), but on the other hand, it fell in other industries (–1.8%) and in the manufacture of coke and refined petroleum products (–2.7%).
graphiqueIRgraph3 – Turnover in manufacturing industry
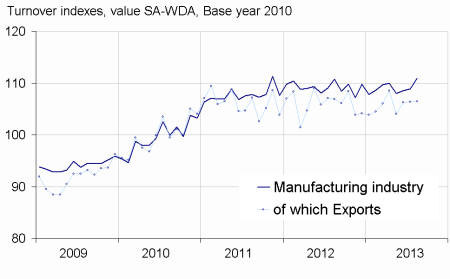
- Source: Insee
Monthly variations
In August 2013, the turnover improved considerably in other industries (+2.1%), mainly in the manufacture of basic metals and fabricated metal products, except machinery and equipment (+2.3%) and in the manufacture of wood and paper products; printing and reproduction of recorded media (+4.8%). It rallied in the manufacture of transport equipment (+3.4%), thanks to a strong rebound in the manufacture of motor vehicles, trailers and semi-trailers (+7.6%). It climbed in the manufacture of coke and refined petroleum (+4.0%). It rose slightly in the electrical and electronic equipment; machine equipment (+0.3%), and it held steady in the manufacture of food products and beverages (+0.1%).
tableauIRtab5 – Variation of the turnover in industry and construction
| Nace Classification | Change in % | ||||
|---|---|---|---|---|---|
| Sectors | Weight** | Aug./ July | July/ June | q-o-q (1) | y-o-y (2) |
| BE : INDUSTRY | 10000 | 1.7 | 0.2 | –0.1 | –0.1 |
| CZ : MANUFACTURING | 8373 | 1.8 | 0.4 | 0.2 | 0.1 |
| Of which Exports | 2731 | 0.1 | 0.1 | 0.2 | –0.2 |
| (C1): Manufacture of food products and beverages | 1647 | 0.1 | 1.9 | –0.3 | 2.4 |
| (C2): Manufacture of coke and refined petroleum products | 478 | 4.0 | 0.2 | 0.9 | –2.7 |
| (C3): Electrical and electronic equipment; machine equipment | 1005 | 0.3 | 0.1 | 0.2 | 0.4 |
| (C4): Manufacture of transport equipment | 1428 | 3.4 | –0.4 | 0.4 | 3.5 |
| (C5): Other manufacturing | 3815 | 2.1 | 0.0 | 0.3 | –1.8 |
| DE: Mining and quarrying; energy; water supply; waste management | 1627 | 1.0 | –1.3 | –1.6 | –1.0 |
| FZ: CONSTRUCTION | 10000 | 0.3 | 0.6 | 0.1 | –1.2 |
- ** 10000=B..E and F
- (1) Quarter-on-quarter: last three months / three previous months
- (2) Year-on-year : last three months / three same months of previous year
- The codes correspond to different levels of aggregation of the NACE classification.
- Source: INSEE
Documentation
Methodology (pdf,140 Ko)
Pour en savoir plus
Time series : Turnover indices (VAT)