

 23 April 2010
2010- n° 110Demand adressed to manufacturing industry remains dynamic in Q1 2010 Quarterly business survey (goods-producing industries) - April 2010
23 April 2010
2010- n° 110Demand adressed to manufacturing industry remains dynamic in Q1 2010 Quarterly business survey (goods-producing industries) - April 2010
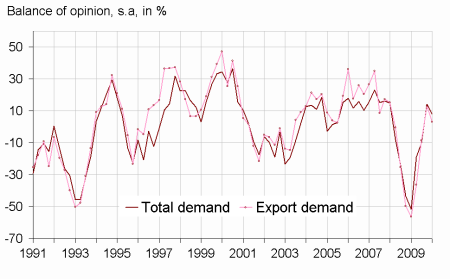
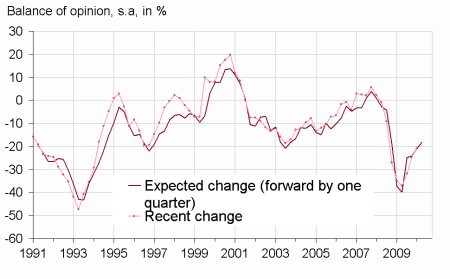
Global demand adressed to business leaders continued to increase in Q1 2010: the balance of opinion stays upper its long-term average, althought its decreased against Q4 2009. Looking at business leader’s expectations, demand would improve anew in Q2 2010. At the same time, export demand slowed down in Q1 2010. It could slow down again in the next three months.

Warning : Business surveys are now published according to the French economic activities and products classification, NAF rev. 2..
Manufacturing industry
Global demand adressed to business leaders continued to increase in Q1 2010: the balance of opinion stays upper its long-term average, although it is inferior to Q4 2009. Looking at business leader’s expectations, demand will improve anew in Q2 2010.
At the same time, export demand slowed down in Q1 2010. It could slow down again in the next three months.
In Q1 2010, production capacity was used as much as in Q4 2009: the proportion of businesses encountering production bottlenecks places near its long term level.
According to business leaders, the fall in industrial manpower attenuated in Q1 2010. They expect the decline in employment to be still less marked over the next three months.
tableautableau – Business leaders' opinion : Demand and production factors
| Manufacturing industry | MOY* | Jul. 09 | Oct. 09 | Jan. 10 | Apr. 10 |
|---|---|---|---|---|---|
| Total demand | |||||
| Recent changes | 0 | –19 | –10 | 14 | 8 |
| Expected change | 1 | –9 | –1 | 0 | 4 |
| Export demand | |||||
| Recent changes | 3 | –36 | –8 | 13 | 3 |
| Expected change | 4 | –11 | 3 | –12 | –3 |
| Production factors | |||||
| Share of firms producing at full capacity (in%) | 22 | 9 | 12 | 23 | 23 |
| Opinion on production capacity | 14 | 35 | 41 | 26 | 13 |
| Productive capacity utilization rate (in %) | 86 | 73 | 75 | 74 | 76 |
| Difficulties of supply and demand | |||||
| Difficulties of supply and demand | 6 | 15 | 9 | 9 | 9 |
| Difficulties of supply | 20 | 7 | 7 | 7 | 17 |
| Difficulties of demand | 43 | 63 | 68 | 64 | 53 |
- * : Long period average.
- Source : Quarterly business survey - INSEE
graphiqueGraph1ang – Recent changes in demand
graphiqueGraph3ang – Workforce in manufacturing industry
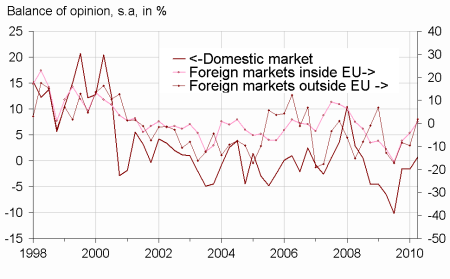
graphiqueGraph4ang – Competitive position
Documentation
Methodology (pdf,48 Ko)
Pour en savoir plus
Time series : Industry