

 10 December 2015
2015- n° 299Employment stabilised in Q3 2015 Payroll employment - 3rd Quarter 2015
10 December 2015
2015- n° 299Employment stabilised in Q3 2015 Payroll employment - 3rd Quarter 2015
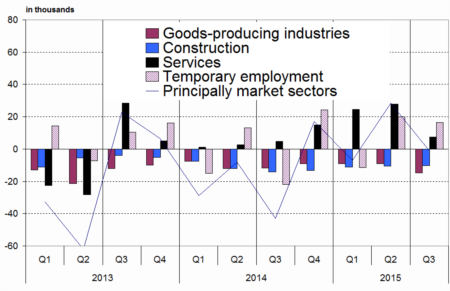
In Q3 2015, payroll employment in the non-farm market sectors stabilised (-900 jobs, that is 0.0%) after a slight increase in the previous quarter (+28,400 jobs, that is +0.2%). Excluding temporary work, employment decreased slightly (-17,300 jobs, i.e. -0.1%, after +8,300 jobs in Q2 2015). Year-on-year, the principally market sectors created 37,600 jobs (+0.2%).
In Q3 2015, payroll employment in the non-farm market sectors stabilised (-900 jobs, that is 0.0%) after a slight increase in the previous quarter (+28,400 jobs, that is +0.2%). Excluding temporary work, employment decreased slightly (-17,300 jobs, i.e. -0.1%, after +8,300 jobs in Q2 2015). Year-on-year, the principally market sectors created 37,600 jobs (+0.2%).
Employment continued to fall in industry and in construction
In Q3 2015, employment continued to shrink in industry (–14,600 jobs, that is –0.5%). It declined further in construction, at a similar pace to that in Q2 (–10,200 jobs, that is –0.8%).
Year-on-year, industry lost 41,400 jobs (–1.3%) whereas construction shed 45,200 jobs (–3.3%).
Employment increased in services, buoyed notably by temporary employment
Temporary workers are recorded in services, regardless of the sector in which they carry out their mission effectively.
Temporary employment continued to increase in Q3 2015 : +16,400 jobs (+3.0%) after +20,100 jobs in Q2 2015.
At the same time, employment in services excluding temporary slowed down (+7,600 jobs, i.e. 0.1 %, after +27,800 in Q2 2015).
Overall, job creation slowed down in the market services sector (+23,900 jobs, that is +0.2%, after +47,900 in the previous quarter, i.e. +0,4%).
Year-on-year, temporary employment rose sharply (+49,200 jobs, i.e. +9.5%) and the market services sector as a whole created 124,200 jobs (+1.1%).
tableautableau_1 – Payroll employment change in the competitive sector : thousands …
| Change in 3 months | Change in 1 year | Level | ||
|---|---|---|---|---|
| 2015 | 2015 | 2015 | 2015 | |
| Q2 | Q3 | Q3 | Q3 | |
| Principally market sectors | 28,4 | –0,9 | 37,6 | 15847,9 |
| Goods-producing industries excl. Construction | –9,0 | –14,6 | –41,4 | 3107,8 |
| Manufacturing | –9,2 | –14,5 | –42,9 | 2739,2 |
| Construction | –10,5 | –10,2 | –45,2 | 1317,7 |
| Services | 47,9 | 23,9 | 124,2 | 11422,4 |
| of which : Temporary employment | 20,1 | 16,4 | 49,2 | 566,2 |
| Principally non-market sectors (*) | 7,6 | 4,9 | 24,5 | 2010,6 |
| Total competitive sector (*) | 36,0 | 4,0 | 62,2 | 17858,5 |
tableautableau_2 – ... Percentage
| Change in 3 months | Change in 1 year | ||
|---|---|---|---|
| 2015 | 2015 | 2015 | |
| Q2 | Q3 | Q3 | |
| Principally market sectors | 0,2 | 0,0 | 0,2 |
| Goods-producing industries excl. Construction | –0,3 | –0,5 | –1,3 |
| Manufacturing | –0,3 | –0,5 | –1,5 |
| Construction | –0,8 | –0,8 | –3,3 |
| Services | 0,4 | 0,2 | 1,1 |
| of which : Temporary employment | 3,8 | 3,0 | 9,5 |
| Principally non-market sectors (*) | 0,4 | 0,2 | 1,2 |
| Total competitive sector (*) | 0,2 | 0,0 | 0,3 |
- (*) Excl. Agriculture and public employees in non-markets sectors (administration, health, education and social activity)
- Source : INSEE
tableautableau_4 – Payroll employment change in the competitive sector (*)
| Code | Change in 3 months | Change in 1 year | Level | ||
|---|---|---|---|---|---|
| Naf | 2015 | 2015 | 2015 | 2015 | |
| rev.2 | Q2 | Q3 | Q3 | Q3 | |
| DE | Electricity, gas, steam, and air conditioning supply ; water supply, sewerage, waste management and remediation activities | 0,2 | –0,1 | 1,5 | 368,5 |
| C1 | Manufacture of food products beverage and tobacco products | –0,5 | –2,1 | –1,7 | 542,4 |
| C2 | Manufacture of coke, and refined petroleum products | 0,0 | 0,0 | –0,1 | 9,6 |
| C3 | Manufacture of computer, electronic and electrical products; manufacture of machinery and equipment | –1,8 | –4,2 | –10,6 | 422,9 |
| C4 | Manufacture of transport equipment | –1,0 | –0,3 | –4,7 | 345,4 |
| C5 | Other manufacturing | –5,9 | –7,8 | –25,9 | 1418,9 |
| FZ | Construction | –10,5 | –10,2 | –45,2 | 1317,7 |
| GZ | Wholesale and retail trade ; repair of motor vehicles and motorcycles | 4,5 | 0,5 | 9,1 | 3006,1 |
| HZ | Transportation and storage | 2,1 | –1,4 | 1,1 | 1336,6 |
| IZ | Accommodation and food service activities | 7,5 | 0,6 | 17,8 | 995,5 |
| JZ | Information and communication | 0,7 | 0,7 | 4,0 | 711,8 |
| KZ | Financial and insurance activities | 3,6 | 0,1 | 7,7 | 850,7 |
| LZ | Real estate activities | 0,2 | 0,0 | 0,4 | 230,2 |
| MN | Professional, scientific and technical activities; administrative and support service activities | 28,7 | 23,9 | 79,5 | 3013,3 |
| of which : Temporary employment | 20,1 | 16,4 | 49,2 | 566,2 | |
| OQ | Public administration and defence ; compulsory social security; education; human health and social work activities | 7,6 | 4,9 | 24,5 | 2010,6 |
| RU | Other service activities | 0,7 | –0,6 | 4,7 | 1278,3 |
- (*) Excl. Agriculture and public employees in non-markets sectors (administration, health, education and social activity)
- Source : INSEE
graphiqueGraph2 – Evolution of principally market sectors
Revisions
The payroll employment estimation of the second quarter of 2015 in the principally market sectors is revised upwards by 4,600 jobs. The estimation of the third quarter of 2015 is revised downwards by 15,800 jobs compared to the Flash estimation released on 13 November 2015.
Documentation
Methodology (pdf,135 Ko)