

 Insee Première ·
June 2025 · n° 2023
Insee Première ·
June 2025 · n° 2023 France’s greenhouse gases emissions and carbon footprint in 2023 France’s greenhouse gases emissions and carbon footprint went significantly down
In 2023, greenhouse gases emissions from France’s resident units (which include some emissions abroad, in particular for air and maritime transportation) amounted to 403 million tons of CO2 equivalent (Mt CO2 eq), that is 5.9 tons per person, whereas France’s carbon footprint amounted to 644 Mt CO2 eq, that is 9.4 tons per person. The difference came from the fact that the emissions imported to satisfy French final demand were markedly higher than the emissions exported by France. French emissions went down by 5.6% compared to 2022, among others because of a decrease in carbon emitting electricity generation. This decline mostly reflected a decrease in emissions exported by France (-12.6%), while emissions dedicated to satisfying domestic final demand were more stable (-1.4%). All in all, the carbon footprint went down by 4.1%, mostly because of the decrease in imported emissions. Since 1990, French emissions have fallen faster than the carbon footprint, in which the share of imports has risen.
- In 2023, French greenhouse gases (GHGs) emissions amounted to 403 Mt CO2 eq, while the country’s carbon footprint was 644 Mt CO2 eq
- In 2023, the reduction in emissions was confirmed with a fall of 5.6%
- The carbon footprint has fallen by 4.1% as a result of the reduction in imported emissions
- The carbon footprint fell over the long term, in spite of the increase in the share of imported emissions
- Although they are five times more intense in terms of GHGs per euro, imports are decarbonising at the same rate as GDP
- Box – Various complementary breakdowns of the carbon footprint in 2021
In 2023, French greenhouse gases (GHGs) emissions amounted to 403 Mt CO2 eq, while the country’s carbon footprint was 644 Mt CO2 eq
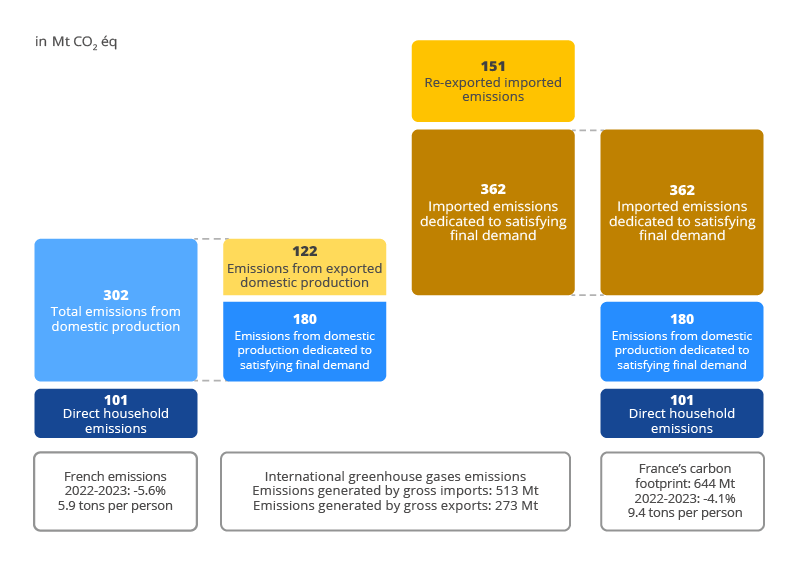
The greenhouse gases (GHGs) emissions from France’s resident units amounted to 403 million tons of CO2 equivalent (Mt CO2 eq) in 2023, 101 Mt of which were generated directly by households through the use of fossil fuels to heat their homes and power their vehicles (Figure 1). The remaining emissions, amounting to 302 Mt, are generated by economic activities. 180 Mt are used to satisfy domestic final demand in France, and 122 Mt are included in the goods and services that are exported to meet final demand in other countries (Sources).
tableauFigure 1 – France’s emissions and carbon footprint in 2023
| Type of emissions | 2023 (in millions of tons CO2 eq) |
Changes 2022-2023 (%) |
|---|---|---|
| Re-exported imported emissions | 151 | -7.4 |
| Imported emissions dedicated to satisfying final demand | 362 | -5.5 |
| Emissions from exported domestic production | 122 | -12.6 |
| Emissions from domestic production dedicated to satisfying final demand | 180 | -1.4 |
| Total emissions from domestic production | 302 | -6.2 |
| Direct household emissions | 101 | -3.6 |
- Notes: France’s emissions correspond to the emissions of French residents (inventory in the AEA format); international flows of greenhouse gases (GHGs) represent the emissions associated with French exports and imports; emissions associated with exports may be “gross” (including re exported imports) or “net” (excluding re exported imports); the carbon footprint is an estimate of the GHGs emissions linked to French final demand, excluding exports.
- Reading note: In 2023, France’s carbon footprint was 644 Mt CO2 eq. It can be broken down into 362 Mt CO2 eq of imported emissions, 180 Mt CO2 eq of domestic emissions and 101 Mt CO2 eq of direct household emissions.
- Coverage: France; GHGs (CO2 + CH4 + N2O + fluorinated gases).
- Sources: INSEE, Eurostat, Citepa, Customs, OECD; INSEE-SDES processing 2024.
graphiqueFigure 1 – France’s emissions and carbon footprint in 2023
- Notes: France’s emissions correspond to the emissions of French residents (inventory in the AEA format); international flows of greenhouse gases (GHGs) represent the emissions associated with French exports and imports; emissions associated with exports may be “gross” (including re exported imports) or “net” (excluding re exported imports); the carbon footprint is an estimate of the GHGs emissions linked to French final demand, excluding exports.
- Reading note: In 2023, France’s carbon footprint was 644 Mt CO2 eq. It can be broken down into 362 Mt CO2 eq of imported emissions, 180 Mt CO2 eq of domestic emissions and 101 Mt CO2 eq of direct household emissions.
- Coverage: France; GHGs (CO2 + CH4 + N2O + fluorinated gases).
- Sources: INSEE, Eurostat, Citepa, Customs, OECD; INSEE-SDES processing 2024.
France also imports goods and services, the production of which involves the generation
of GHGs emissions abroad. The total emissions embodied in imports amount to 513 Mt CO2 eq, the majority of which (362 Mt) are dedicated to satisfying French final demand
(“imported” emissions). The remainder end up being embodied in goods and services
that are manufactured in France, but then re-exported to the rest of the world.
Therefore France’s carbon footprint, which corresponds to emissions dedicated to satisfying French final demand, is estimated
at 644 Mt in 2023. 101 Mt are generated directly by households (16%), 180 Mt by French
economic activities (28%) and 362 Mt are imported (56%). Of those imported emissions,
146 Mt are associated with final use imports (23% of the footprint) and 216 Mt with
imports for the purposes of domestic economic activities (34%).
In 2023, the reduction in emissions was confirmed with a fall of 5.6%
Following an unprecedented drop linked to the health crisis (-10.4% between 2019 and 2020), France’s emissions saw a partial resurgence in 2021 (+5.8%), before falling again in 2022 (-2.9%). The decline accelerated in 2023 (-5.6% or -23.9 Mt CO2 eq), while GDP increased by 0.9%. Emissions totalled 403 Mt CO2 eq or 5.9 tons of CO2 eq per person, compared with 6.9 tons in 2019.
Direct household emissions fell by 3.6% in 2023, or -3.8 Mt, reflecting reduced consumption of fossil fuels in connection with their homes (-6.6%, or -2.3 Mt) and vehicles (‑2.3%, or -1.5 Mt). These reductions are down to more economical behaviour, warmer winter weather and the improved energy efficiency of vehicles and housing.
The net reduction in the emissions of the various sectors of economic activity (-6.2%, or -20.1 Mt) is the result of both economic circumstances (improved availability of nuclear power generation infrastructure, the composition of economic growth, taking account in particular of the lack of dynamism of energy-intensive industries, the weather, etc.) and structural factors (energy efficiency of production means, decarbonisation trend of the energy mix, etc.) (Figure 2).
tableauFigure 2 – Change in French GHGs emissions and value added by industry between 2022 and 2023
| Indicators | Agriculture, forestry and fishing | Industry | Of which: | Construction | Commercial services | Of which: | Non-commercial services | All sectors | ||
|---|---|---|---|---|---|---|---|---|---|---|
| Mining and quarrying, energy and waste | Manufacture of industrial products1 | Hospitality | ||||||||
| A | B to E | BDE | C5 | F | G to M and R to U | I55-56 | O to Q | |||
| Greenhouse gases (GHGs) emissions | ||||||||||
| 2019 | in kt CO2 eq | 80 911 | 142 737 | 52 598 | 65 369 | 8 949 | 99 840 | 2 566 | 15 245 | 347 681 |
| 2020 | 80 338 | 128 490 | 49 384 | 57 499 | 7 967 | 81 826 | 2 263 | 13 849 | 312 470 | |
| 2021 | 78 750 | 136 257 | 50 622 | 64 351 | 8 894 | 90 103 | 2 414 | 15 474 | 329 479 | |
| 2022 | 76 432 | 130 902 | 51 411 | 59 261 | 8 888 | 92 585 | 2 076 | 13 426 | 322 233 | |
| 2023 | 75 123 | 117 071 | 43 724 | 54 197 | 8 514 | 88 313 | 1 958 | 13 096 | 302 116 | |
| 2019/2020 | as a % | -0.7 | -10.0 | -6.1 | -12.0 | -11.0 | -18.0 | -11.8 | -9.2 | -10.1 |
| 2020/2021 | -2.0 | 6.0 | 2.5 | 11.9 | 11.6 | 10.1 | 6.7 | 11.7 | 5.4 | |
| 2021/2022 | -2.9 | -3.9 | 1.6 | -7.9 | -0.1 | 2.8 | -14.0 | -13.2 | -2.2 | |
| 2022/2023 | -1.7 | -10.6 | -15.0 | -8.5 | -4.2 | -4.6 | -5.7 | -2.5 | -6.2 | |
| 2019/2023 | -7.2 | -18.0 | -16.9 | -17.1 | -4.9 | -11.5 | -23.7 | -14.1 | -13.1 | |
| Value added, chain-linked volumes, 2020 base | ||||||||||
| 2019 | in billions of constant euros | 36.4 | 286.2 | 50.9 | 128.8 | 126.1 | 1 272.9 | 52.1 | 496.2 | 2 218.4 |
| 2020 | 33.9 | 261.2 | 46.9 | 117.7 | 116.0 | 1 173.9 | 28.8 | 471.6 | 2 056.5 | |
| 2021 | 32.2 | 278.5 | 45.7 | 125.0 | 122.6 | 1 256.7 | 32.5 | 501.0 | 2 191.1 | |
| 2022 | 34.6 | 263.1 | 34.2 | 123.2 | 118.8 | 1 326.9 | 46.9 | 509.4 | 2 253.3 | |
| 2023 | 36.2 | 277.6 | 42.2 | 123.4 | 121.1 | 1 343.2 | 52.9 | 505.3 | 2 285.5 | |
| 2019/2020 | as a % | -7.0 | -8.7 | -7.9 | -8.6 | -8.0 | -7.8 | -44.7 | -5.0 | -7.3 |
| 2020/2021 | -4.8 | 6.6 | -2.6 | 6.2 | 5.7 | 7.1 | 12.9 | 6.2 | 6.5 | |
| 2021/2022 | 7.2 | -5.5 | -25.1 | -1.4 | -3.1 | 5.6 | 44.2 | 1.7 | 2.8 | |
| 2022/2023 | 4.9 | 5.5 | 23.3 | 0.2 | 1.9 | 1.2 | 12.8 | -0.8 | 1.4 | |
| 2019/2023 | -0.5 | -3.0 | -17.1 | -4.2 | -4.0 | 5.5 | 1.5 | 1.8 | 3.0 | |
- 1. Excluding agri-food, automobile, electrical and electronic equipment.
- Notes: The sum of monetary values of the sectors does not necessarily correspond to the value of all sectors combined due to the nature of the prices (value added in chained prices, 2020 base).
- Reading note: Between 2022 and 2023, French greenhouse gases (GHGs) emissions fell by 6.2%, and value added increased by 1.4% in constant euros.
- Coverage: France; GHGs (CO2 + CH4 + N2O + fluorinated gases).
- Sources: INSEE, Citepa; INSEE-SDES processing 2024.
graphiqueFigure 2 – Change in French GHGs emissions and value added by industry between 2022 and 2023

- 1. Excluding agri-food, automobile, electrical and electronic equipment.
- Notes: The sum of monetary values of the sectors does not necessarily correspond to the value of all sectors combined due to the nature of the prices (value added in chained prices, 2020 base).
- Reading note: Between 2022 and 2023, French greenhouse gases (GHGs) emissions fell by 6.2%, and value added increased by 1.4% in constant euros.
- Coverage: France; GHGs (CO2 + CH4 + N2O + fluorinated gases).
- Sources: INSEE, Citepa; INSEE-SDES processing 2024.
In 2023, with the exception of air transportation, all sectors of activity contributed to reducing emissions. The reduced emissions in the agriculture sector (-1.3 Mt) can essentially be explained by the decrease in the bovine population and the reduced use of fertilisers, in spite of a slight uptick in the volumes being produced. In 2022, the unprecedented shutdown of a large number of nuclear reactors increased reliance on thermal power stations for the production of electricity. In 2023, the availability of the nuclear fleet improved and renewable energy production increased, bringing about a 7.7 Mt drop in GHGs emissions. Reduced industrial activity brought about reductions in the emissions generated by metallurgy (-2.2 Mt). the production of cement and other non-metallic minerals (-1.3 Mt), chemistry (‑1.0 Mt) and the agri-food industry (-0.8 Mt). The hospitality industry saw an uptick in its activities, but was also able to mitigate its emissions, thanks in particular to lower energy consumption. The emissions generated by international maritime transportation fell (-3.5 Mt), while those generated by air transportation increased for the third consecutive year (+1.8 Mt) as a result of the resumption of flights following the health crisis.
In the medium to long-term, the majority of industries and the economy as a whole are experiencing a decoupling of production trends from GHGs emissions trends: emissions are falling while economic activity (production and value added), measured in constant euros, is increasing. This decoupling may result from a number of different factors: outsourcing of carbon-intensive manufacturing processes; using less carbon-intensive inputs (in particular energy products); changing the nature of the products manufactured; or adopting lower emission technologies, processes or behaviours.
Between 2022 and 2023, emission reductions were mostly observed in those industries geared more towards international demand than domestic demand (manufacturing industry and maritime transportation in particular). This explains why exported emissions fell by 12.6% or ‑17.6 Mt CO2 eq and accounted for 85% of the decrease in emissions linked to French economic activity (while exports increased by 2.1% in constant euros in 2023). At the same time, the French emissions contained within the goods and services dedicated to satisfying French domestic final demand only fell by 1.4% (-2.5 Mt) against a backdrop of relatively stable domestic final demand (+0.3% in constant euros).
Over the longer term, France’s emissions have fallen by 31% since 1990, largely due to the reduction of emissions in the industrial sector.
The carbon footprint has fallen by 4.1% as a result of the reduction in imported emissions
In 2023, France’s carbon footprint was estimated at 644 Mt CO2 eq, a drop of 4.1% when compared with 2022 (-27 Mt CO2 eq). Between 2019 and 2020, the carbon footprint fell by an unprecedented 10.3% as a result of the health crisis. In 2021, when restrictions on movement were lifted and economic activities and international trade resumed, the carbon footprint jumped back up by +7.4%, then remained broadly stable in 2022 (+0.8%). In 2023, the carbon footprint fell once again, reaching 9.4 tons per capita, compared with 10.3 tons in 2019, before the health crisis.
Emissions from French and foreign economic activities dedicated to satisfying domestic final demand, which account for 84% of the carbon footprint, amount to 542 Mt CO2 eq, a decrease of 4.2% when compared with 2022 (Figure 3). While domestic emissions (excluding households) remained broadly stable (-1.4% or -2.5 Mt CO2 eq), imported emissions fell by 5.5% (-21.0 Mt CO2 eq), accounting for three quarters of the total reduction of the carbon footprint. This reduction in imported emissions was due in particular to the fall in imports of mineral products (including cement) and clothing, but also to reduced imports of hydrocarbons and electricity, which had seen a significant increase in 2022 due to the geopolitical context (replenishment of gas stocks) and the reduced availability of the nuclear fleet. Direct household emissions, 101 Mt CO2 eq or 16% of the carbon footprint, fell by 3.6% (-3.8 Mt), as mentioned above.
tableauFigure 3 – The carbon footprint and its components from 1990 to 2023
| Years | Households | Domestic emissions | Imported emissions | Total footprint |
|---|---|---|---|---|
| 1990 | 126 | 296 | 321 | 743 |
| 1991 | 134 | 303 | 308 | 745 |
| 1992 | 136 | 297 | 302 | 735 |
| 1993 | 134 | 284 | 259 | 678 |
| 1994 | 130 | 275 | 270 | 675 |
| 1995 | 131 | 272 | 296 | 699 |
| 1996 | 139 | 271 | 296 | 706 |
| 1997 | 135 | 250 | 287 | 672 |
| 1998 | 140 | 289 | 310 | 739 |
| 1999 | 141 | 288 | 303 | 733 |
| 2000 | 139 | 278 | 316 | 734 |
| 2001 | 146 | 280 | 316 | 742 |
| 2002 | 144 | 281 | 322 | 747 |
| 2003 | 147 | 283 | 354 | 784 |
| 2004 | 150 | 277 | 391 | 818 |
| 2005 | 148 | 277 | 411 | 835 |
| 2006 | 145 | 271 | 432 | 847 |
| 2007 | 137 | 275 | 457 | 869 |
| 2008 | 139 | 263 | 474 | 876 |
| 2009 | 139 | 259 | 399 | 797 |
| 2010 | 138 | 253 | 409 | 800 |
| 2011 | 130 | 235 | 443 | 808 |
| 2012 | 134 | 235 | 392 | 762 |
| 2013 | 135 | 232 | 387 | 754 |
| 2014 | 123 | 216 | 382 | 721 |
| 2015 | 126 | 216 | 354 | 696 |
| 2016 | 127 | 219 | 341 | 688 |
| 2017 | 125 | 223 | 358 | 706 |
| 2018 | 119 | 214 | 372 | 704 |
| 2019 | 116 | 208 | 367 | 691 |
| 2020 | 103 | 189 | 327 | 620 |
| 2021 | 111 | 192 | 363 | 666 |
| 2022 | 105 | 183 | 383 | 671 |
| 2023 | 101 | 180 | 362 | 644 |
- Notes: Each series represents the carbon footprint of a single year. The data from 1990 to 2009 are backcast based on the calculation for 2010, and the 2022 and 2023 data are provisional.
- Reading note: In 2023, the carbon footprint associated with final demand was 644 Mt CO2 eq.
- Coverage: France; GHGs (CO2 + CH4 + N2O + fluorinated gases).
- Sources: INSEE, Eurostat, Citepa, Customs, OECD; INSEE-SDES processing 2024.
graphiqueFigure 3 – The carbon footprint and its components from 1990 to 2023
- Notes: Each series represents the carbon footprint of a single year. The data from 1990 to 2009 are backcast based on the calculation for 2010, and the 2022 and 2023 data are provisional.
- Reading note: In 2023, the carbon footprint associated with final demand was 644 Mt CO2 eq.
- Coverage: France; GHGs (CO2 + CH4 + N2O + fluorinated gases).
- Sources: INSEE, Eurostat, Citepa, Customs, OECD; INSEE-SDES processing 2024.
Final household consumption was behind 64% of the footprint (not including direct household emissions), the final consumption of administrative bodies and non-profit organisations accounted for 13% and investments and inventory changes for 23%. Although final household consumption increased (+0.8% in constant euros), the associated footprint decreased by 1.5% or -5 Mt CO2 eq. This decoupling of household consumption trends and the associated emissions is also observed for investments (+0.4% in constant euros and -5.1% in terms of footprint, or -7 Mt CO2 eq). Inventory changes produced a footprint of just 2 Mt in 2023, compared with 12 Mt in 2022. The reduction in emissions associated with inventories (-10 Mt) therefore represents more than one third of the decrease in the footprint between those two years.
Gas and electricity (-8.7 Mt), construction products (-5.6 Mt) and clothing (-3.0 Mt) are the main products contributing to the reduction of the footprint. Conversely, the footprint associated with the demand for air transportation increased (+3.2 Mt), together with that associated with motor vehicles (+2.6 Mt), linked to the resurgence in the number of new vehicles being registered. Final demand for commercial and public services rose by 1.7% in constant euros, but did not bring about a significant increase in emissions (Box).
The carbon footprint fell over the long term, in spite of the increase in the share of imported emissions
Emissions by French residents have fallen by 31% since 1990 (and by 41% per capita, taking account of population growth): direct household emissions have fallen by 20%, emissions generated by economic activities dedicated to satisfying foreign final demand (exported emissions) have fallen by 26% and those dedicated to satisfying French final demand have fallen by 39%. However, France’s carbon footprint has reduced more slowly, by just 13% since 1990 (and by 26% per capita), reflecting a dual trend: a fall in emissions from domestic production (-39%) and direct household emissions (-20%), tempered by an increase in imported emissions (+13%).
Imported emissions would therefore represent 56% of the carbon footprint in 2023 compared with 43% in 1990. Several factors contribute to the increase in imported emissions: the relocation of certain production activities (for example, textile production halved in constant euro terms in France during the period, while consumption remained relatively stable), and an increase in French final demand for products that are primarily produced abroad (smartphones, for example).
In 2023, gross emissions associated with imports (513 Mt) were far higher than those generated by gross exports (273 Mt). In particular, trade in energy products and industrial goods resulted in the net import of approximately 207 Mt of GHGs. The only exception was the trade in aeronautical equipment, with an export balance of +7 Mt. For services, the trade balance is broadly at a surplus (+40 billion euros); however, the net GHGs associated are close to zero (‑3 Mt). In fact, the amount of GHGs produced per euro of foreign service activities is, on average, higher than for domestic service activities.
Although they are five times more intense in terms of GHGs per euro, imports are decarbonising at the same rate as GDP
In 2023, the GHGs intensity of GDP was 118 grams of CO2 eq per euro, whereas the GHGs content of imports was 618 grams of CO2 eq per euro (Figure 4). The composition of these two aggregates is actually very different: imports primarily involve products with a high carbon content (energy products, metals, goods manufactured in countries with a very carbon-heavy energy mix), which are essential to the functioning of the national economy, while French GDP mostly covers industrial transformation activities that are less GHGs-intense, or services. The unit content of French exports (335 grams of CO2 eq per euro) is also primarily attributable to manufactured goods. Lastly, the carbon footprint excluding direct household emissions, which includes domestic and imported emissions, recorded a GHGs content of 210 grams of CO2 eq per euro of final demand.
tableauFigure 4 – GHGs content per euro of GDP, imports, domestic final demand and exports
| Year | GDP | Imports | Exports | Domestic final demand |
|---|---|---|---|---|
| 2010 | 182.0 | 981.5 | 538.3 | 298.8 |
| 2011 | 170.1 | 1 011.4 | 535.8 | 299.1 |
| 2012 | 168.8 | 896.7 | 489.8 | 278.2 |
| 2013 | 165.5 | 854.0 | 465.3 | 272.0 |
| 2014 | 154.4 | 809.2 | 440.9 | 259.2 |
| 2015 | 152.6 | 701.9 | 399.7 | 243.1 |
| 2016 | 150.9 | 649.5 | 376.2 | 235.8 |
| 2017 | 152.0 | 660.1 | 385.0 | 239.4 |
| 2018 | 145.1 | 666.3 | 377.5 | 237.9 |
| 2019 | 138.8 | 648.1 | 366.6 | 229.1 |
| 2020 | 134.8 | 633.4 | 363.3 | 219.1 |
| 2021 | 133.0 | 672.6 | 387.3 | 222.0 |
| 2022 | 126.8 | 660.1 | 378.9 | 220.1 |
| 2023 | 117.8 | 618.1 | 334.8 | 210.3 |
- Notes: Each series represents the quantity of greenhouse gases (GHGs) per euro of various economic aggregates.
- Reading note: In 2023, GDP generated 117.8 grams of CO2 per euro.
- Coverage: France; GHGs (CO2 + CH4 + N2O + fluorinated gases); economic data in constant euros, 2020 base.
- Sources: INSEE, Eurostat, Citepa, Customs, OECD; INSEE-SDES processing 2024.
graphiqueFigure 4 – GHGs content per euro of GDP, imports, domestic final demand and exports
- Notes: Each series represents the quantity of greenhouse gases (GHGs) per euro of various economic aggregates.
- Reading note: In 2023, GDP generated 117.8 grams of CO2 per euro.
- Coverage: France; GHGs (CO2 + CH4 + N2O + fluorinated gases); economic data in constant euros, 2020 base.
- Sources: INSEE, Eurostat, Citepa, Customs, OECD; INSEE-SDES processing 2024.
Between 2010 and 2023, emissions generated by domestic economic activities (excluding direct household emissions) fell by 25%, with the total footprint reducing by 18%. Over that same period, the gross domestic product and final demand rose by 15% and 16% respectively in constant euros. This means that the GHGs emissions intensity of GDP has fallen (-35% over that same period), as has the GHGs content per euro of final demand (-30%). GDP (-3.3% per year on average) and imports (-3.5% per year) are decarbonising at relatively similar rates, while the content per euro of domestic final demand is decreasing at a slower pace (-2.7% per year) due to the growing share of imported emissions.
Box – Various complementary breakdowns of the carbon footprint in 2021
The carbon footprint can be broken down according to several complementary approaches.
The figures presented here relate to 2021, the latest year based on an exhaustive
set of economic data.
France's carbon footprint can be broken down according to the geographical origin
of emissions: 45% of GHGs are emitted in France, 13% come from the European Union
outside France, 9% from China, 6% from Russia and 2% from the United States. This
structure differs from that of French imports of goods and services. Indeed, a finished
product imported from a given country is the result of an often complex and globalized
production process that may have generated emissions in different countries around
the world, as it moves up the value chain.
Imported emissions can themselves be distinguished according to their destination
in the French economy: 42% are destined directly for final household consumption (notably
in manufactured goods or fuels), while the remaining 58% are used as inputs by domestic
industries to produce goods and services for French final demand (agricultural, energetic,
metallic or chemical products, etc.).
The carbon footprint can also be broken down according to the industries responsible
for worldwide GHGs emissions: excluding direct household emissions, emissions come
mainly from manufacturing industry (26%), agriculture (21%), electricity production
(18%), extractive industries and transport services (10% each) and only 6% from market
and non-market services.
If we look at the final goods and services in which the GHGs are contained, the structure
is different: 42% of the GHGs in the carbon footprint are incorporated in the products
of manufacturing industry and 24% in market and non-market services, the latter including
in particular part of the emissions from agriculture and energy.
Finally, the carbon footprint can be broken down by “main consumption categories”:
travel, housing and food account for 68% of the footprint's emissions, while 1.2 tonnes
of CO2 eq per person per year are attributable to public services.
Sources
Air Emissions Accounts (AEAs) are inventories of gaseous emissions, based on a nomenclature identical to that used for national accounts. They cover direct emissions from industries and households; for example, emissions from electricity generation are allocated to the “electricity generation” industry, not to the final consumer. AEAs list the emissions of domestic resident units: for transport, the emissions of French residents abroad are included, while the emissions of foreigners in France are excluded. For this reason, total emissions (403 Mt CO2 eq in 2023) differ slightly from the inventories published by Citepa in UNFCCC and SECTEN formats, which record emissions occurring on French territory (373 Mt CO2 eq).
The carbon footprint estimate is based on macroeconomic modelling, which aims to assign annual global GHGs emissions
to the goods and services which are subject to final demand in each country. The economic
information comes from the “Figaro” multi-regional input-output tables (MRIO) developed
by Eurostat, and from the French national accounts. MRIOs describe the origin of production,
the relationships between industries and the nationality of consumers of each good
and service. The carbon footprint is estimated by combining the MRIO (harmonized with
the results of the French national accounts) and the AEAs of all the countries in
the world. In the absence of complete detailed data, results prior to 2010 are based
on a back casting, and those after 2021 are provisional estimates. In these provisional
estimates, French data on GHGs emissions and final monetary demand are known, but
the GHGs content per euro of imported goods is forecasted, considering past trends
and price variations.
The figures in this publication are accompanied by complementary tables covering the
years 1990 to 2023, which present the various breakdowns of air emissions and carbon
footprint accounts: by type of greenhouse gas, by geographic origin and activity of
emissions, by products and institutional sectors of final demand, as well as international
comparisons. They are available on the SDES and Insee websites.
Définitions
Greenhouse gases (GHGs) emissions are the emissions of carbon dioxide (CO2), methane (CH4), nitrous oxide (N2O) and fluorinated gases (PFCs, HFCs, NF3 and SF6) linked to the activities of households and productive industries, which lead to the retention of part of the heat received from the sun in the atmosphere.
French domestic final demand is made up of final consumption by households, general government, non-profit institutions serving households (NPISHs) and gross capital formation (investments and changes in inventories).
France's carbon footprint represents the greenhouse gas emissions induced by French domestic final demand, whether the goods or services consumed are produced domestically or imported. Conversely, French emissions associated with exports do not contribute to the carbon footprint.
The GHGs intensity of French GDP is the ratio between emissions from economic activities (excluding households’ direct emissions) and gross domestic product (GDP).
Learn more
Baude M., Larrieu S., "Estimating the French carbon footprint from 1990 to 2023 – an official statistics methodology based on FIGARO", Working papers, Insee, to be published.
Citepa, « Ouvrir dans un nouvel ongletÉmissions de gaz à effet de serre en France : nouvelle estimation - L’année 2023 avec les données Secten du Citepa », mai 2024.
Eurostat, Ouvrir dans un nouvel ongletÉmissions mondiales de CO2 – L’UE vis-à-vis du reste du monde, février 2024.
Baude M., « Ouvrir dans un nouvel ongletL’empreinte carbone de la France de 1995 à 2022 », Derniers résultats, SDES, octobre 2023.