

 16 February 2021
2021- n° 037In Q4 2020, the unemployment rate fell back again to 8.0 % ILO Unemployment and Labour Market-related indicators (Labour Force Survey results)
- fourth quarter 2020
16 February 2021
2021- n° 037In Q4 2020, the unemployment rate fell back again to 8.0 % ILO Unemployment and Labour Market-related indicators (Labour Force Survey results)
- fourth quarter 2020
In Q4 2020 the number of ILO unemployed people reached 2.4 millions in France excluding Mayotte, decreasing by 340,000. The ILO unemployment rate fell by 1.1 points over the quarter to 8.0% of the labor force, after a 2.0 point rebound in the previous quarter. It was almost stable (-0.1 points) compared with its pre-crisis level in Q4 2019.
The decrease in unemployment in the quarter was primarily due to the increase in the employment rate, which recovered again on average over the quarter. But, as in the second quarter, the fall in unemployment was also partly a "trompe-l'oeil" fall: due to the second confinement, between October 30 and December 15, a significant number of people switched to inactivity (halo around unemployment or inactivity outside the halo), not being able to make active job search under the usual conditions. On the other hand, the increase in employment should be put into perspective by the decline in hours worked per job.

This publication, released quarterly, presents the results of the Labour Force survey for the latest quarter. It does not, as such, aim to analyse the effect of the health crisis on the labour market. A background note on the labour market impacts of the health crisis (in French) is associated with this publication.
As in the first three quarters of 2020, the Labour Force survey in Q4 2020 has been affected by the health crisis in two ways.
On the one hand, the health crisis strongly impacted the situation of people on the labour market (see background note).
On the other hand, the second containment has again constrained collection, resulting in a drop in the collection rate. From October 30 to November 10, tracking operations were completely suspended and face-to-face interviews for the first and last interviews had to be switched to telephone mode, as soon as the respondents' contact information could be found. After November 10, tracking operations resumed, but interviews continued to be carried out by telephone until the end of the quarter. In the end, the collection rate stood at 61.1% in Q4 2020 (-2.6 percentage points over a year).
However, the usual statistical adjustment methods make it possible to obtain data that remain representative of the entire population over the whole period.
- Another downturn in unemployment rate in Q4 2020.
- The halo around unemployment slightly increased over the quarter, the effect of the second containment being much more moderate than the first.
- The employment rate recovered again on average over the quarter.
- Underemployment rose again.
- Full-time rate rose further ; part-time rate employment declined
- Permanent employment rate rose ; fixed-term or temporary employment rate was almost stable, below its pre-crisis level
- The activity rate worsened over the quarter and over the year
- The situation of young people on the labour market improved over the quarter
- Revisions and next estimate
- For more information
Another downturn in unemployment rate in Q4 2020.
In Q4 2020 the number of ILO unemployed people reached 2.4 millions in France excluding Mayotte, decreasing by 340,000. The ILO unemployment rate fell by 1.1 points over the quarter to 8.0% of the labor force, after a 2.0 point rebound in the previous quarter. It was almost stable (-0.1 points) compared with its pre-crisis level in Q4 2019.
The decrease in unemployment in the quarter was primarily due to the increase in the employment rate, which recovered again on average over the quarter. But, as in the second quarter, the fall in unemployment was also partly a "trompe-l'oeil" fall: due to the second confinement, between October 30 and December 15, a significant number of people switched to inactivity (halo around unemployment or inactivity outside the halo), not being able to make active job search under the usual conditions. On the other hand, the increase in employment should be put into perspective by the decline in hours worked per job.
The decline in the unemployment rate over the quarter affected all age and sex groups. It was more pronounced for people aged 15 to 24 (-3.6 points) than for those aged 25-49 (-1.0 point) and those aged 50 or older (-0.4 points). Thus the unemployment rate was below its level a year earlier for youths (-1.5 points) and almost at the same level for their elders (+0.1 points for those aged 25-49; -0.1 points for those aged 50 and over).
tableauILO-unemployment rate
| France (excl. Mayotte) | Metropolitan France | |
|---|---|---|
| 2003-Q1 | 8.4 | 8.0 |
| 2003-Q2 | 8.5 | 8.1 |
| 2003-Q3 | 8.4 | 8.0 |
| 2003-Q4 | 8.8 | 8.4 |
| 2004-Q1 | 9.0 | 8.6 |
| 2004-Q2 | 8.8 | 8.4 |
| 2004-Q3 | 8.9 | 8.5 |
| 2004-Q4 | 8.9 | 8.5 |
| 2005-Q1 | 8.7 | 8.3 |
| 2005-Q2 | 8.8 | 8.4 |
| 2005-Q3 | 9.0 | 8.6 |
| 2005-Q4 | 9.0 | 8.7 |
| 2006-Q1 | 9.1 | 8.8 |
| 2006-Q2 | 9.0 | 8.6 |
| 2006-Q3 | 8.9 | 8.5 |
| 2006-Q4 | 8.4 | 8.0 |
| 2007-Q1 | 8.5 | 8.1 |
| 2007-Q2 | 8.1 | 7.8 |
| 2007-Q3 | 8.0 | 7.6 |
| 2007-Q4 | 7.5 | 7.1 |
| 2008-Q1 | 7.2 | 6.8 |
| 2008-Q2 | 7.3 | 7.0 |
| 2008-Q3 | 7.4 | 7.1 |
| 2008-Q4 | 7.7 | 7.4 |
| 2009-Q1 | 8.6 | 8.2 |
| 2009-Q2 | 9.2 | 8.8 |
| 2009-Q3 | 9.2 | 8.8 |
| 2009-Q4 | 9.5 | 9.1 |
| 2010-Q1 | 9.4 | 9.0 |
| 2010-Q2 | 9.3 | 8.9 |
| 2010-Q3 | 9.2 | 8.8 |
| 2010-Q4 | 9.2 | 8.8 |
| 2011-Q1 | 9.1 | 8.8 |
| 2011-Q2 | 9.1 | 8.7 |
| 2011-Q3 | 9.2 | 8.8 |
| 2011-Q4 | 9.4 | 9.0 |
| 2012-Q1 | 9.5 | 9.1 |
| 2012-Q2 | 9.7 | 9.3 |
| 2012-Q3 | 9.8 | 9.4 |
| 2012-Q4 | 10.1 | 9.7 |
| 2013-Q1 | 10.3 | 9.9 |
| 2013-Q2 | 10.5 | 10.1 |
| 2013-Q3 | 10.3 | 9.9 |
| 2013-Q4 | 10.1 | 9.8 |
| 2014-Q1 | 10.1 | 9.8 |
| 2014-Q2 | 10.2 | 9.8 |
| 2014-Q3 | 10.3 | 9.9 |
| 2014-Q4 | 10.4 | 10.1 |
| 2015-Q1 | 10.3 | 10.0 |
| 2015-Q2 | 10.5 | 10.2 |
| 2015-Q3 | 10.4 | 10.0 |
| 2015-Q4 | 10.2 | 9.9 |
| 2016-Q1 | 10.2 | 9.9 |
| 2016-Q2 | 10.0 | 9.7 |
| 2016-Q3 | 9.9 | 9.6 |
| 2016-Q4 | 10.0 | 9.7 |
| 2017-Q1 | 9.6 | 9.3 |
| 2017-Q2 | 9.5 | 9.2 |
| 2017-Q3 | 9.5 | 9.2 |
| 2017-Q4 | 9.0 | 8.6 |
| 2018-Q1 | 9.2 | 8.9 |
| 2018-Q2 | 9.1 | 8.8 |
| 2018-Q3 | 9.0 | 8.7 |
| 2018-Q4 | 8.7 | 8.4 |
| 2019-Q1 | 8.7 | 8.4 |
| 2019-Q2 | 8.4 | 8.1 |
| 2019-Q3 | 8.4 | 8.2 |
| 2019-Q4 | 8.1 | 7.8 |
| 2020-Q1 | 7.8 | 7.6 |
| 2020-Q2 | 7.1 | 7.0 |
| 2020-Q3 | 9.1 | 8.9 |
| 2020-Q4 | 8.0 | 7.7 |
- Estimation within +/-0.3 point of the level of unemployment rate and of its quarterly variations.
graphiqueILO-unemployment rate

- Estimation within +/-0.3 point of the level of unemployment rate and of its quarterly variations.
- Scope: population of people living in households, people aged 15 years or more.
- Source: INSEE, Labour Force Survey.
tableauILO-unemployment rate
| ILO-unemployment rate (%) | Variation in points over | Thousands | |||
|---|---|---|---|---|---|
| 2020Q3 | 2020Q4 | quarter | year | 2020Q4 | |
| Unemployed persons | 9.1 | 8.0 | -1.1 | -0.1 | 2,353 |
| 15-24 years | 22.0 | 18.4 | -3.6 | -1.5 | 509 |
| 25-49 years | 8.5 | 7.5 | -1.0 | 0.1 | 1,324 |
| 50 years and more | 6.1 | 5.7 | -0.4 | -0.1 | 519 |
| Men | 9.1 | 8.0 | -1.1 | -0.2 | 1,215 |
| 15-24 years | 21.8 | 19.0 | -2.8 | -1.6 | 279 |
| 25-49 years | 8.6 | 7.4 | -1.2 | 0.2 | 672 |
| 50 years and more | 5.9 | 5.7 | -0.2 | -0.3 | 264 |
| Women | 9.1 | 7.9 | -1.2 | -0.1 | 1,138 |
| 15-24 years | 22.3 | 17.7 | -4.6 | -1.3 | 230 |
| 25-49 years | 8.5 | 7.6 | -0.9 | 0.0 | 652 |
| 50 years and more | 6.4 | 5.7 | -0.7 | 0.1 | 255 |
| Long-term unemployed persons | 3.3 | 3.1 | -0.2 | -0.1 | 927 |
- Scope : population of people living in households, people aged 15 years or more in France excluding Mayotte
- Source: INSEE, Labour Force Survey
The halo around unemployment slightly increased over the quarter, the effect of the second containment being much more moderate than the first.
Among the inactive people as defined by the ILO, 1.8 million want a job without being considered unemployed: they made up the halo around unemployment. After a peak in Q2 and a decline in the Q3, their numbers rose slightly in Q4 2020. The peak in the halo of unemployment in Q2 2020, due to the first containment, was the main counterpart to the fall in unemployment at the same time. It was mainly made of jobless people wishing to work and available to do so, but not actively searching for a job. With the end of the first confinement, unemployed persons resumed their active job search, mechanically reducing the number of people in the halo around unemployment Q3 2020. During the second confinement, many job searches ceased again, but to a lesser extent than during the first confinement. Thus, the share of the halo in the population aged 15-64 increased by 0.1 points over the quarter, after +1.9 points and -2.0 points in Q2 and Q3. It reached 4.1%, 0.1 points above its level a year earlier.
tableauPeople in the halo of unemployment
| Halo of unemployment (in thousands) (left scale) | Share of the population aged 15 to 64 years (in %) (right scale) | |
|---|---|---|
| 2003-Q1 | 1274 | 3.2 |
| 2003-Q2 | 1218 | 3.0 |
| 2003-Q3 | 1309 | 3.3 |
| 2003-Q4 | 1311 | 3.2 |
| 2004-Q1 | 1327 | 3.3 |
| 2004-Q2 | 1342 | 3.3 |
| 2004-Q3 | 1349 | 3.3 |
| 2004-Q4 | 1318 | 3.3 |
| 2005-Q1 | 1293 | 3.2 |
| 2005-Q2 | 1295 | 3.2 |
| 2005-Q3 | 1269 | 3.1 |
| 2005-Q4 | 1273 | 3.1 |
| 2006-Q1 | 1301 | 3.2 |
| 2006-Q2 | 1305 | 3.2 |
| 2006-Q3 | 1290 | 3.1 |
| 2006-Q4 | 1356 | 3.3 |
| 2007-Q1 | 1283 | 3.1 |
| 2007-Q2 | 1303 | 3.1 |
| 2007-Q3 | 1226 | 3.0 |
| 2007-Q4 | 1235 | 3.0 |
| 2008-Q1 | 1259 | 3.0 |
| 2008-Q2 | 1222 | 2.9 |
| 2008-Q3 | 1261 | 3.0 |
| 2008-Q4 | 1242 | 3.0 |
| 2009-Q1 | 1285 | 3.1 |
| 2009-Q2 | 1310 | 3.1 |
| 2009-Q3 | 1343 | 3.2 |
| 2009-Q4 | 1370 | 3.3 |
| 2010-Q1 | 1334 | 3.2 |
| 2010-Q2 | 1364 | 3.3 |
| 2010-Q3 | 1347 | 3.2 |
| 2010-Q4 | 1330 | 3.2 |
| 2011-Q1 | 1389 | 3.3 |
| 2011-Q2 | 1409 | 3.4 |
| 2011-Q3 | 1421 | 3.4 |
| 2011-Q4 | 1418 | 3.4 |
| 2012-Q1 | 1406 | 3.4 |
| 2012-Q2 | 1377 | 3.3 |
| 2012-Q3 | 1430 | 3.4 |
| 2012-Q4 | 1407 | 3.4 |
| 2013-Q1 | 1374 | 3.3 |
| 2013-Q2 | 1389 | 3.3 |
| 2013-Q3 | 1430 | 3.4 |
| 2013-Q4 | 1453 | 3.4 |
| 2014-Q1 | 1494 | 3.5 |
| 2014-Q2 | 1459 | 3.5 |
| 2014-Q3 | 1541 | 3.7 |
| 2014-Q4 | 1533 | 3.6 |
| 2015-Q1 | 1602 | 3.8 |
| 2015-Q2 | 1557 | 3.7 |
| 2015-Q3 | 1532 | 3.7 |
| 2015-Q4 | 1537 | 3.7 |
| 2016-Q1 | 1567 | 3.7 |
| 2016-Q2 | 1616 | 3.9 |
| 2016-Q3 | 1611 | 3.9 |
| 2016-Q4 | 1599 | 3.8 |
| 2017-Q1 | 1629 | 3.9 |
| 2017-Q2 | 1615 | 3.8 |
| 2017-Q3 | 1560 | 3.7 |
| 2017-Q4 | 1609 | 3.8 |
| 2018-Q1 | 1622 | 3.8 |
| 2018-Q2 | 1612 | 3.8 |
| 2018-Q3 | 1612 | 3.8 |
| 2018-Q4 | 1616 | 3.8 |
| 2019-Q1 | 1529 | 3.6 |
| 2019-Q2 | 1599 | 3.8 |
| 2019-Q3 | 1633 | 3.9 |
| 2019-Q4 | 1698 | 4.0 |
| 2020-Q1 | 1741 | 4.1 |
| 2020-Q2 | 2508 | 6.0 |
| 2020-Q3 | 1704 | 4.0 |
| 2020-Q4 | 1753 | 4.1 |
graphiquePeople in the halo of unemployment
- Scope: population of people living in households in France excluding Mayotte, people aged 15 years or over
- Source: INSEE, Labour Force Survey
The employment rate recovered again on average over the quarter.
On average in Q4 2020, the employment rate for 15-64 year olds increased by 0.6 points to 65.6%, after a similar increase (+0.6 points) in the third quarter.
Employment recovered again for all age and sex groups, except for young men (-0.8 points). The rise is more pronounced for women (+1.0 point), especially youth (+2.1 points).
But the increase in the employment rate over the last two quarters did not offset the decline in Q2 (-1.6 points). Thus the employment rate remained below its level a year earlier (-0.4 points), especially for people aged 25 to 49 (-0.5 points) and those aged 15 to 24 (-0.3 points); however, it was up for 50-64 year olds (+0.4 points).
tableauEmployment rate by age group
| 15-24 years old (right scale) | 25-49 years old (left scale) | 50-64 years old (left scale) | |
|---|---|---|---|
| 2003-Q1 | 31.6 | 80.5 | 53.5 |
| 2003-Q2 | 30.6 | 80.3 | 53.3 |
| 2003-Q3 | 30.5 | 80.4 | 53.0 |
| 2003-Q4 | 30.0 | 80.4 | 53.1 |
| 2004-Q1 | 30.2 | 80.3 | 53.2 |
| 2004-Q2 | 29.9 | 80.6 | 53.1 |
| 2004-Q3 | 30.3 | 80.3 | 53.6 |
| 2004-Q4 | 30.1 | 80.3 | 53.8 |
| 2005-Q1 | 29.5 | 80.5 | 54.0 |
| 2005-Q2 | 30.6 | 80.3 | 53.8 |
| 2005-Q3 | 29.5 | 80.6 | 53.4 |
| 2005-Q4 | 29.8 | 80.5 | 53.0 |
| 2006-Q1 | 29.1 | 80.6 | 53.2 |
| 2006-Q2 | 29.4 | 80.7 | 52.9 |
| 2006-Q3 | 29.7 | 81.2 | 53.1 |
| 2006-Q4 | 29.5 | 81.3 | 53.4 |
| 2007-Q1 | 29.9 | 81.4 | 53.1 |
| 2007-Q2 | 30.2 | 81.6 | 53.2 |
| 2007-Q3 | 31.0 | 81.7 | 53.2 |
| 2007-Q4 | 31.3 | 82.3 | 53.1 |
| 2008-Q1 | 31.4 | 82.8 | 53.0 |
| 2008-Q2 | 30.7 | 83.0 | 52.9 |
| 2008-Q3 | 30.7 | 82.9 | 53.0 |
| 2008-Q4 | 30.7 | 82.8 | 53.4 |
| 2009-Q1 | 30.6 | 81.9 | 53.5 |
| 2009-Q2 | 30.1 | 81.6 | 53.7 |
| 2009-Q3 | 29.6 | 81.5 | 53.1 |
| 2009-Q4 | 29.5 | 81.3 | 53.1 |
| 2010-Q1 | 30.0 | 81.5 | 53.6 |
| 2010-Q2 | 29.7 | 81.4 | 53.8 |
| 2010-Q3 | 29.1 | 81.5 | 54.2 |
| 2010-Q4 | 29.6 | 81.1 | 54.0 |
| 2011-Q1 | 29.1 | 81.3 | 54.2 |
| 2011-Q2 | 29.4 | 81.1 | 54.3 |
| 2011-Q3 | 29.2 | 80.7 | 54.8 |
| 2011-Q4 | 28.6 | 80.6 | 55.5 |
| 2012-Q1 | 28.4 | 80.3 | 56.1 |
| 2012-Q2 | 28.2 | 80.3 | 56.6 |
| 2012-Q3 | 28.0 | 80.2 | 57.0 |
| 2012-Q4 | 27.8 | 80.2 | 57.5 |
| 2013-Q1 | 27.9 | 79.8 | 57.2 |
| 2013-Q2 | 27.8 | 80.0 | 57.3 |
| 2013-Q3 | 27.9 | 80.2 | 57.5 |
| 2013-Q4 | 28.1 | 80.0 | 57.7 |
| 2014-Q1 | 28.0 | 80.0 | 58.0 |
| 2014-Q2 | 27.8 | 79.8 | 58.4 |
| 2014-Q3 | 27.6 | 79.5 | 58.6 |
| 2014-Q4 | 27.2 | 79.6 | 59.0 |
| 2015-Q1 | 28.0 | 79.3 | 59.1 |
| 2015-Q2 | 27.8 | 79.2 | 59.5 |
| 2015-Q3 | 28.1 | 79.4 | 59.7 |
| 2015-Q4 | 28.1 | 79.6 | 59.6 |
| 2016-Q1 | 28.0 | 79.6 | 60.1 |
| 2016-Q2 | 28.2 | 79.6 | 60.3 |
| 2016-Q3 | 27.5 | 79.9 | 60.6 |
| 2016-Q4 | 28.2 | 79.5 | 60.5 |
| 2017-Q1 | 28.1 | 79.6 | 60.6 |
| 2017-Q2 | 28.5 | 80.3 | 61.3 |
| 2017-Q3 | 28.8 | 80.1 | 61.1 |
| 2017-Q4 | 29.4 | 80.4 | 61.9 |
| 2018-Q1 | 29.1 | 80.4 | 62.0 |
| 2018-Q2 | 29.5 | 80.5 | 62.0 |
| 2018-Q3 | 29.9 | 80.5 | 62.3 |
| 2018-Q4 | 30.4 | 80.7 | 62.3 |
| 2019-Q1 | 29.8 | 80.8 | 62.4 |
| 2019-Q2 | 29.7 | 80.9 | 62.5 |
| 2019-Q3 | 29.4 | 80.6 | 62.3 |
| 2019-Q4 | 29.5 | 81.4 | 63.4 |
| 2020-Q1 | 29.5 | 81.5 | 63.5 |
| 2020-Q2 | 26.6 | 79.8 | 63.0 |
| 2020-Q3 | 28.6 | 80.3 | 63.1 |
| 2020-Q4 | 29.2 | 80.9 | 63.8 |
graphiqueEmployment rate by age group
- Scope: population of people living in households in France excluding Mayotte, people aged 15-64 years.
- Source: INSEE, Labour Force Survey.
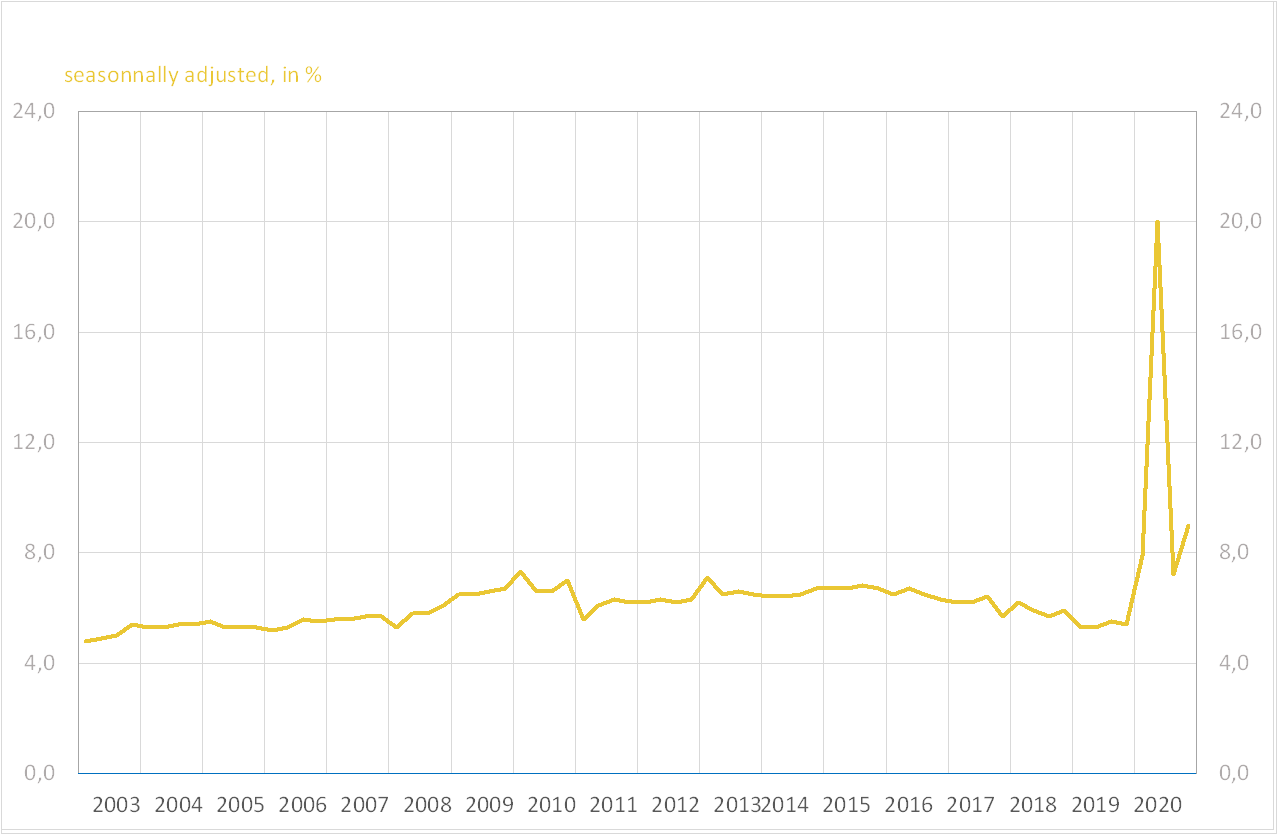
Underemployment rose again.
In Q4 2020, as a result of the partial activity framework during the second containment period, underemployment rose again (+1.7 points) to 8.9 %. It reached an exceptional peak in Q2 at 20.0 % of employed people, including 15.3 % of people in technical or partial unemployment, and then declined in Q3. As in the second quarter, the increase in underemployment was exclusively among those who involuntarily worked less than usual (including short-time working): +2.1 points to 4.2 %.
graphiqueILO underemployment rate
- Scope : France excluding Mayotte, employed people from households, aged 15 and over.
- Source : Insee, Labour Force survey.
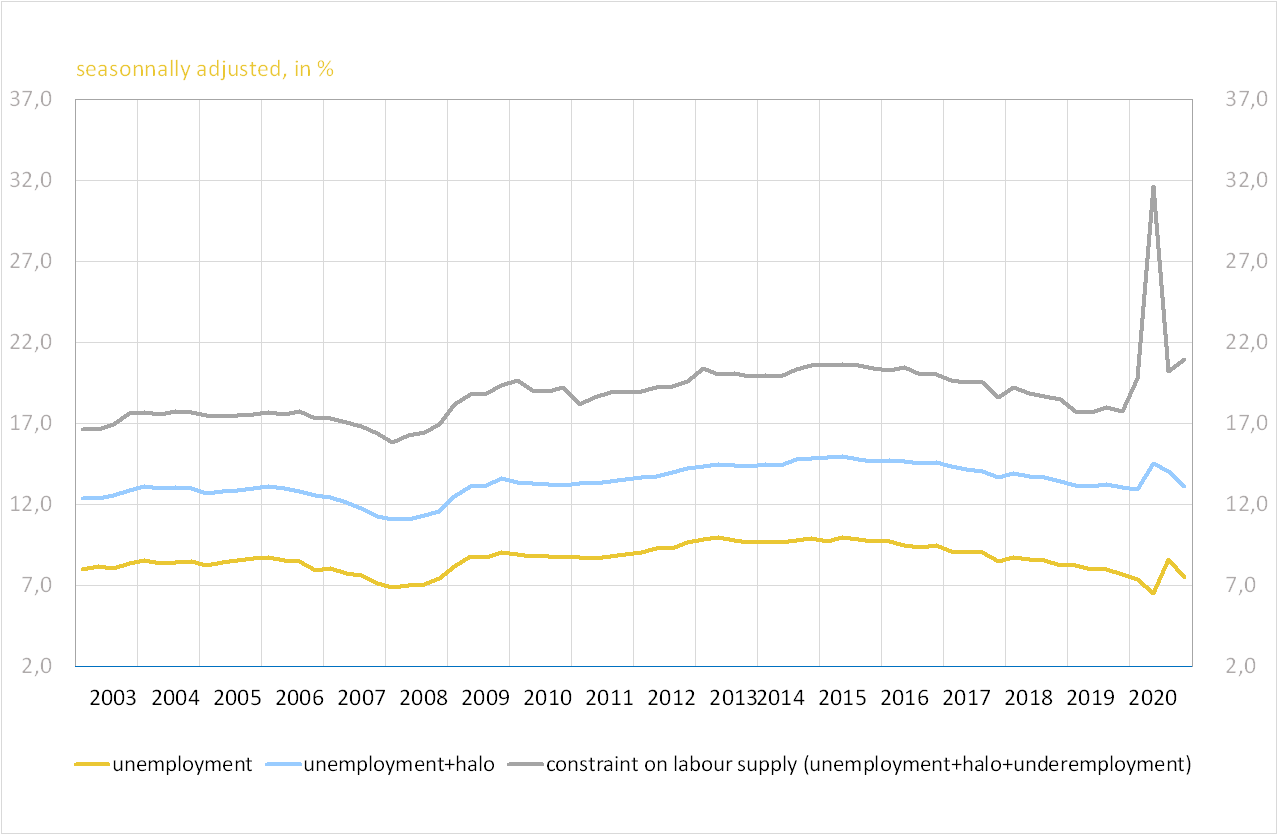
All in all, in Q4 2020, more than one in five labor market participants (active people or people in the halo around unemployment) were constrained in their labour supply by either a lack of employment (unemployed or in the halo around unemployment) or a situation of underemployment. This share increased by 0.8 points over the quarter to 21.0 %; it stood 3.3 points above its end of 2019 level but remained 10.7 points below its peak in Q2 2020 .
graphiqueFrom unemployment to labour market supply constraint: shares among participants (employment, unemployment, halo) in the labour market
- Champ : France excluding Mayotte, people from households, aged 15 to 64.
- Source : Insee, Labour Force survey.
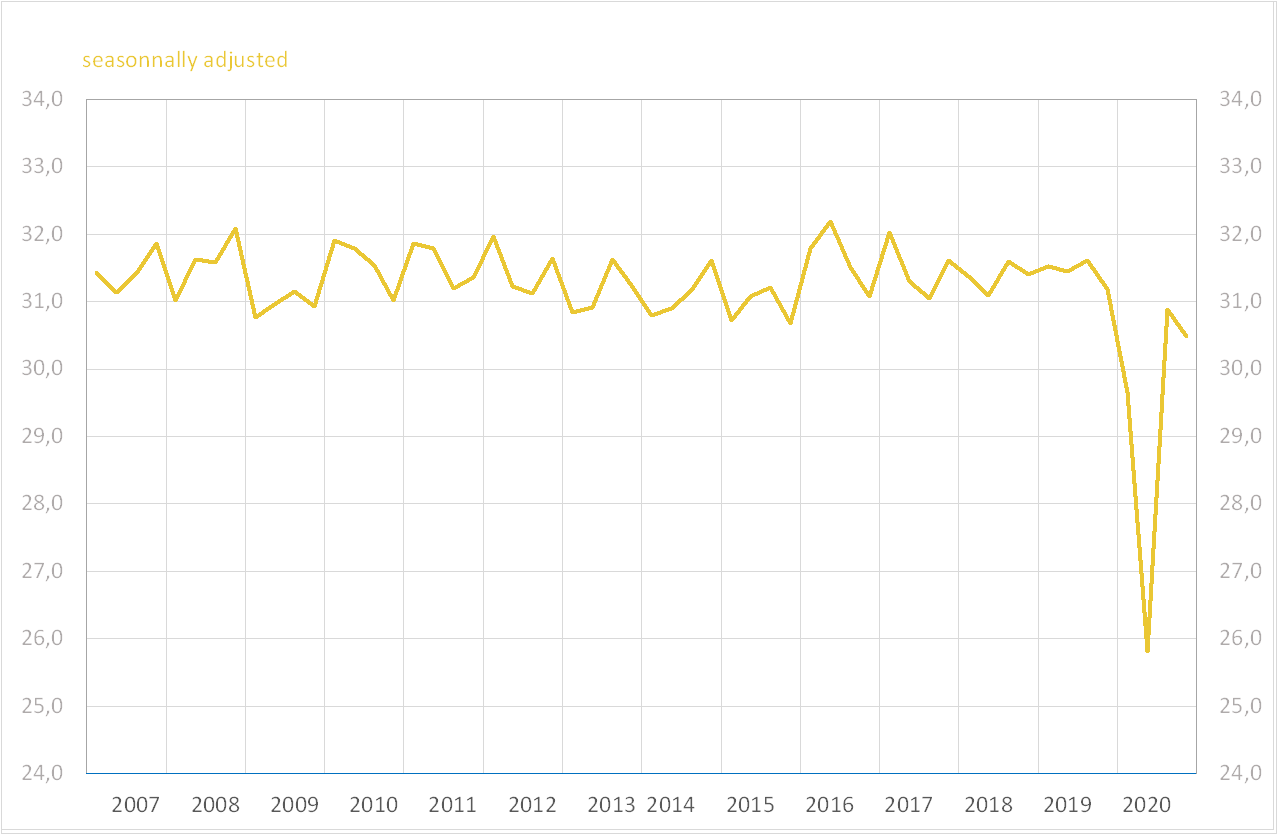
The average number of weekly hours worked per job fell by 1.3% in Q4 2020 to 30.5 hours per week (seasonally adjusted data). After an unprecedented low in Q2 (-13.1 %), the average number of hours worked per job recovered (+19.8 %) in Q3 2020 to 30.9 hours per week. At the end of 2020, the average number of hours worked per job was 2.2 % below its level reached a year earlier.
graphiqueAverage number of worked hours per week and job
- Scope : metropolitan France, employed people from households, aged 15 to 64.
- Source : Insee, Labour Force survey.
Full-time rate rose further ; part-time rate employment declined
Full-time employment rate stood at 54.6% in Q4 2020. It increased by 0.7 points over the quarter, and 0.2 points compared to the-end of 2019. In contrast, part-time employment rate declined over the quarter (-0.2 points) and year-on-year (-0.6 points). As a result, the proportion of part-time employment fell by 0.8 points over a year to 17.4 %.
Permanent employment rate rose ; fixed-term or temporary employment rate was almost stable, below its pre-crisis level
Permanent employment rate for people aged 15 to 64 stood at 49.8% in Q4 2020. It increased by 0.6 points, after a stability the previous quarter. It was 0.4 points above its end of 2019 level.
Fixed-term and temporary employment rate was virtually stable over the quarter (+0.1 points), after a fall in Q2 and a partial upturn in Q3. At 7.0%, it was 1.1 points below its end of 2017 peak and 0.7 points below its end of 2019 level.
tableauILO employment rate in the population aged 15-64 years
| % of people in the age group | Variation in over | |||
|---|---|---|---|---|
| 2020Q3 | 2020Q4 | quarter | year | |
| Employed people | 65.0 | 65.6 | 0.6 | -0.4 |
| by sex | ||||
| Men | 68.4 | 68.6 | 0.2 | -0.5 |
| Women | 61.8 | 62.8 | 1.0 | -0.2 |
| by age | ||||
| 15-24 years | 28.6 | 29.2 | 0.6 | -0.3 |
| 25-49 years | 80.3 | 80.9 | 0.6 | -0.5 |
| 50-64 years | 63.1 | 63.8 | 0.7 | 0.4 |
| Included : 55-64 years | 53.5 | 54.4 | 0.9 | 0.3 |
| by type of employment contract | ||||
| Permanent employment | 49.2 | 49.8 | 0.6 | 0.4 |
| Fixed-term and temporary employment | 6.9 | 7.0 | 0.1 | -0.7 |
| Other types of employment | 8.9 | 8.9 | 0.0 | 0.0 |
| by contractual working time | ||||
| Full-time employment | 53.9 | 54.6 | 0.7 | 0.2 |
| Part-time employment | 11.2 | 11.0 | -0.2 | -0.6 |
| Full-time equivalent employment rate | 60.6 | 61.2 | 0.6 | -0.1 |
- Scope: population of people living in households in France excluding Mayotte, people aged 15-64 years
- Source: INSEE, Labour Force Survey
The activity rate worsened over the quarter and over the year
The activity rate of people aged 15 to 64 fell again by 0.2 points over the quarter, to 71.4%. It fell dramatically by 2.3 points in Q2 2020, due to the first containment, and recovered by 2.2 points in Q3.
Overall, the activity rate was below its end of 2019 level, before the health crisis: 0.4 points lower for the whole population, 0.6 points lower for men in particular. This year-on-year decline was the result of a shift in part of the active population into inactivity, either into halo for people who stop looking for work during the confinement period, or into inactivity outside the halo.
The activity rate fell sharply for men (-0.7 points) over the quarter while it was almost stable for women (+0.1 points). The decline concerned people aged 15 to 24 (-0.9 points) and those aged 25 to 49 (-0.4 points). Conversely, the activity rate of 50-64 year-old peeple increased (+0.4 points), particularly for those aged 55-64 (+0.9 points).
tableauILO activity rate in the population aged 15-64 years
| % of people in the age group | Variation in points over | |||
|---|---|---|---|---|
| 2020Q3 | 2020Q4 | quarter | year | |
| Active people | 71.6 | 71.4 | -0.2 | -0.4 |
| by sex | ||||
| Men | 75.4 | 74.7 | -0.7 | -0.6 |
| Women | 68.1 | 68.2 | 0.1 | -0.3 |
| by age | ||||
| 15-24 years | 36.7 | 35.8 | -0.9 | -1.0 |
| 25-49 years | 87.8 | 87.4 | -0.4 | -0.5 |
| 50-64 years | 67.4 | 67.8 | 0.4 | 0.4 |
| Included : 55-64 years | 57.1 | 58.0 | 0.9 | 0.3 |
- Scope: population of people living in households in France excluding Mayotte, people aged 15-64 years
- Source: INSEE, Labour Force Survey
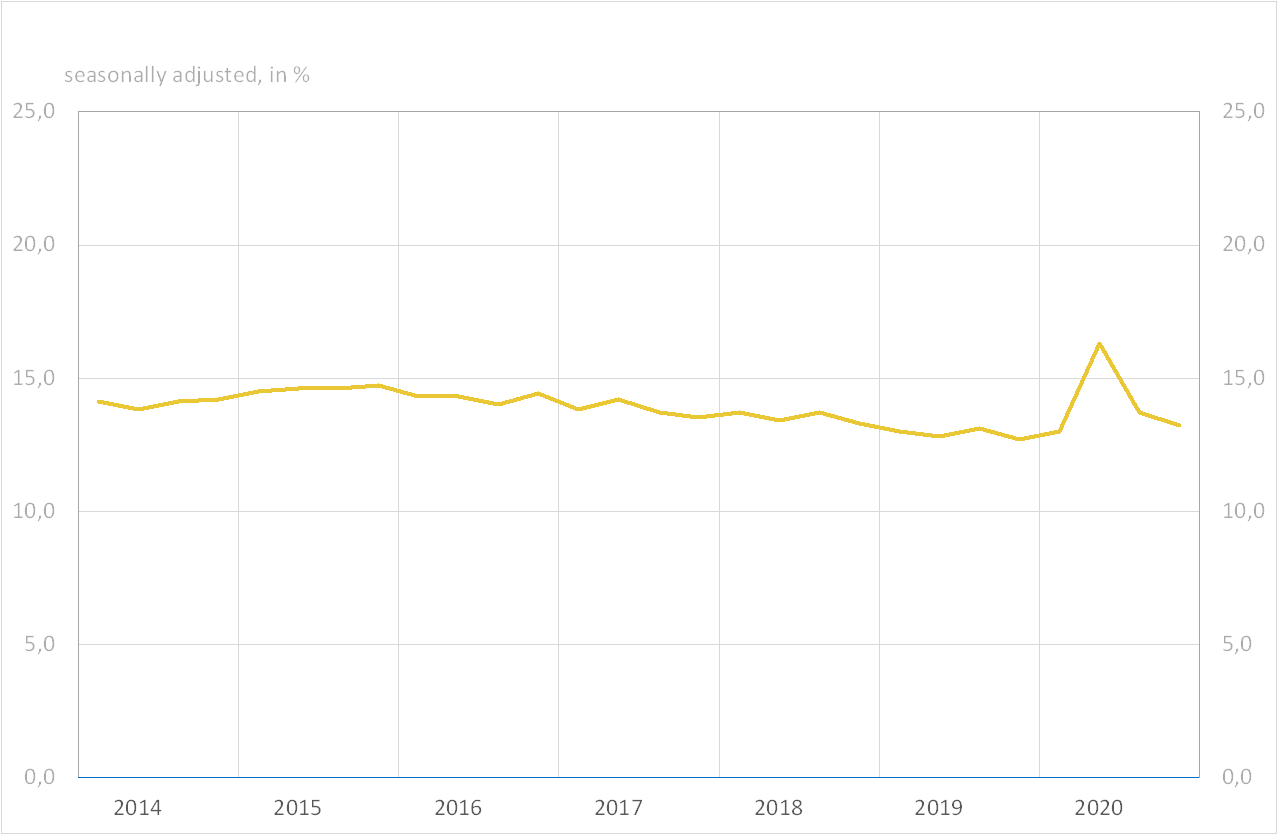
The situation of young people on the labour market improved over the quarter
Given the relative improvement in youth employment in Q4 2020, the share of people aged 15 to 29 who are neither employed nor in training (NEET) declined by 0.5 points to 13.2 %, after a peak in Q2 and a decline in Q3. However, it remained 0.5 points above its pre-crisis level, at the end of 2019.
graphiqueShare of people aged 15 to 29 neither in employment nor in education or training (NEET)
- Scope : France excluding Mayotte, employed people from households, aged 15 to 29.
- Source : Insee, Labour Force survey.
Revisions and next estimate
Compared to the first estimate published on November 10, 2020, the unemployment rate for the third quarter of 2020 was up by 0.1 points to 9.1%, due to the updating of seasonal variation coefficients.
The next publication, about Q1 2021, is scheduled for 24 June 2021 at 7:30 am. This release will lead to larger than usual revisions due to the redesign of the Labor Force Survey.
Indeed the Labor Force survey is evolving in order to comply with the new European regulation on social statistics (Integrated European Social Statistics). Its questionnaire will be renewed from Q1 2021 both to ensure better European harmonization and to better meet its users needs and the new challenges of the labor market. In addition, its protocol will be modernized: after an initial face-to-face interview, respondents will be offered the possibility of answering on the Internet for further interviews.
These changes, as well as a revision of the weighting method, will be likely to change levels of indicators from the survey starting with Q1 2021 publication. In order to prepare for this as well as possible, throughout 2020 and in Q1 2021, a vast methodological operation is be carried out. It will make it possible to estimate the breaks in series introduced by the introduction of the new survey. Economic indicators for the Q1 2021 publication will be published on June 24, 2021 with the levels of this new survey. They will be accompanied with retropolated series "without breaks", in order to continue to shed light on labour market conditions over a long period of time.
.
For more information
An unemployed person according to the International Labour Office (ILO) is someone aged 15 or more who is not employed during the reference week, is available to work within two weeks and looked actively for a job in the previous month (or has found a job beginning in less than three months).
A NEET (neither in employment nor in education or training) person who is not in employment, education or training (formal or non-formal).
Pour en savoir plus
