

 13 August 2020
2020- n° 203In Q2 2020, the labour market under the influence of containment ILO Unemployment and Labour Market-related indicators (Labour Force Survey results)
- second quarter 2020
13 August 2020
2020- n° 203In Q2 2020, the labour market under the influence of containment ILO Unemployment and Labour Market-related indicators (Labour Force Survey results)
- second quarter 2020
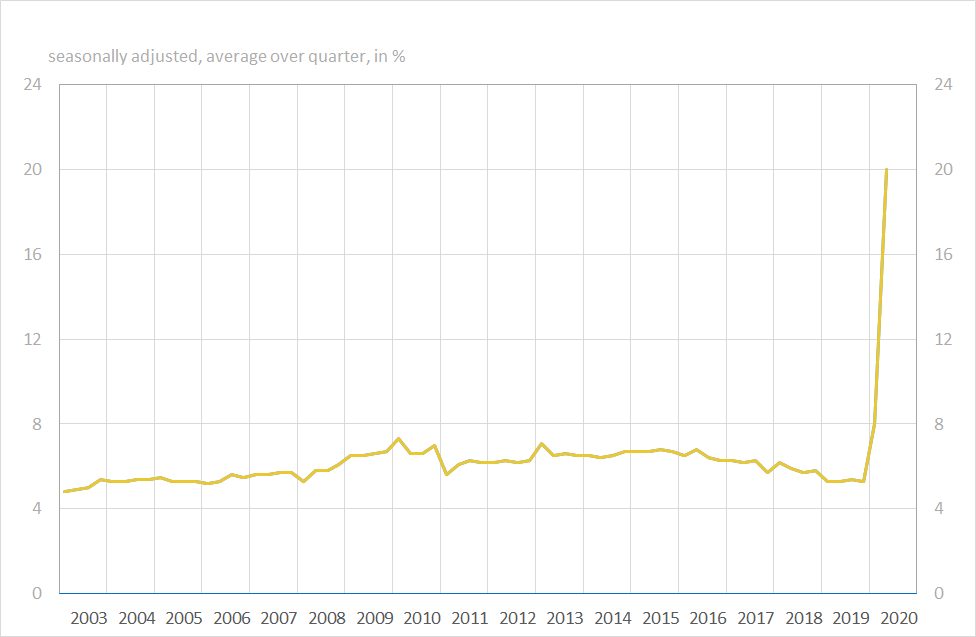
In Q2 2020, the number of ILO unemployed people decreased by 271,000 to 2.0 million people. The ILO unemployment rate thus fell by 0.7 points over the quarter to 7.1% of the labour force in France excluding Mayotte, after already −0.3 points in the previous quarter. It was 1.3 points lower than its level one year earlier. The unemployment rate fell sharply for people aged 25 to 49 years (−0.8 points) and those aged 50 and over (−1.0 points), but increased strongly for people aged 15-24 years (+1.8 points). The unemployment rate decreased more strongly for women (−1.1 points) than men (−0.3 points).
This sharp fall in unemployment while the employment is declining (see below) is inherent to the definition of unemployment. In fact, an ILO unemployed person is a person aged 15 or over who meets the three following criteria: is unemployed during a given week; is available for work in the next two weeks; has been actively looking for work in the last four weeks or has found a job starting within three months.
In Q2 2020, the drop in the unemployment rate resulted from a sharp fall in the number of jobless persons declaring themselves actively looking for work during the period of lockdown. The confinement period indeed strongly affected active job search behaviour during the first part of the quarter (for unemployed persons whose preferred sector of activity was at a standstill, for example).
Overall, in Q2 2020, the sharp fall in ILO unemployment did not reflect an improvement in the labour market, but rather a lockdown effect for jobless people exceeding the increase in the number of jobless people. For more information, see the background note associated with this publication (internet link 1, in French).

This publication, released quarterly, presents the results of the Labour Force survey for the latest quarter. It does not, as such, aim to analyse the effect of the health crisis and containment on the labour market. Indeed, all the indicators presented are calculated on average over the quarter. Thus they are only partially affected by the generalized lockdown that took place from March 17 to May 10, and which concerns around 6 weeks out of 13 in Q2 2020. A note on the impacts of the health crisis on the labour market (in French) is associated with this publication. It presents in detail the results of the Labour Force survey for this period with, exceptionally, weekly data.
The Labour Force survey for the second quarter of 2020 is affected by the health crisis in two ways. On the one hand, as at the end of the previous quarter, the situation of people on the labour market was strongly marked by containment during the first six weeks of the quarter. On the other hand, the collection of the survey had to be adapted. Instead of the usual face-to-face interviews, the first and last interviews had to be conducted by telephone. As households are interviewed 6 times, the change in protocol only affected one third of the sample over the quarter.. These degraded collection conditions led to a decline in the collection rate. However, the usual adjustment methods make it possible to obtain data that remain representative of the entire population. The methodological note associated with this publication (web link 2, in English) provides additional information on these points. In line with Eurostat recommendations, the survey questionnaire has not been modified in order to be able to compare the indicators over time with unchanged concepts and methods.
- A trompe l'oeil decline in ILO unemployment except for youths
- As the main counterpart to the fall in unemployment, the halo of unemployment took off in Q2 2020
- The employment rate fell drastically in Q2 2020, especially for youths
- Underemployment jumped to an unprecedented level as a result of partial unemployment
- Full-time and part-time employment rates decreased together
- Fixed-term or temporary employment rate sharply dropped
- The activity rate collapsed in Q2 2020
- Revisions
- For more information
A trompe l'oeil decline in ILO unemployment except for youths
In Q2 2020, the number of ILO unemployed people decreased by 271,000 to 2.0 million people. The ILO unemployment rate thus fell by 0.7 points over the quarter to 7.1% of the labour force in France excluding Mayotte, after already −0.3 points in the previous quarter. It was 1.3 points lower than its level one year earlier. The unemployment rate fell sharply for people aged 25 to 49 years (−0.8 points) and those aged 50 and over (−1.0 points), but increased strongly for people aged 15-24 years (+1.8 points). The unemployment rate decreased more strongly for women (−1.1 points) than men (−0.3 points).
This sharp fall in unemployment while the employment is declining (see below) is inherent to the definition of unemployment. In fact, an ILO unemployed person is a person aged 15 or over who meets the three following criteria: is unemployed during a given week; is available for work in the next two weeks; has been actively looking for work in the last four weeks or has found a job starting within three months.
In Q2 2020, the drop in the unemployment rate resulted from a sharp fall in the number of jobless persons declaring themselves actively looking for work during the period of lockdown. The confinement period indeed strongly affected active job search behaviour during the first part of the quarter (for unemployed persons whose preferred sector of activity was at a standstill, for example).
Overall, in Q2 2020, the sharp fall in ILO unemployment did not reflect an improvement in the labour market, but rather a lockdown effect for jobless people exceeding the increase in the number of jobless people. For more information, see the background note associated with this publication (internet link 1, in French).
tableauILO-unemployment rate
| France (excl. Mayotte) | Metropolitan France | |
|---|---|---|
| 2003-Q1 | 8.4 | 8.0 |
| 2003-Q2 | 8.5 | 8.1 |
| 2003-Q3 | 8.4 | 8.0 |
| 2003-Q4 | 8.8 | 8.4 |
| 2004-Q1 | 9.0 | 8.6 |
| 2004-Q2 | 8.8 | 8.4 |
| 2004-Q3 | 8.9 | 8.5 |
| 2004-Q4 | 8.9 | 8.5 |
| 2005-Q1 | 8.7 | 8.3 |
| 2005-Q2 | 8.8 | 8.4 |
| 2005-Q3 | 9.0 | 8.6 |
| 2005-Q4 | 9.0 | 8.7 |
| 2006-Q1 | 9.1 | 8.8 |
| 2006-Q2 | 9.0 | 8.6 |
| 2006-Q3 | 8.9 | 8.5 |
| 2006-Q4 | 8.4 | 8.0 |
| 2007-Q1 | 8.5 | 8.1 |
| 2007-Q2 | 8.1 | 7.8 |
| 2007-Q3 | 8.0 | 7.6 |
| 2007-Q4 | 7.5 | 7.1 |
| 2008-Q1 | 7.2 | 6.8 |
| 2008-Q2 | 7.3 | 7.0 |
| 2008-Q3 | 7.4 | 7.1 |
| 2008-Q4 | 7.7 | 7.4 |
| 2009-Q1 | 8.6 | 8.2 |
| 2009-Q2 | 9.2 | 8.8 |
| 2009-Q3 | 9.2 | 8.8 |
| 2009-Q4 | 9.5 | 9.1 |
| 2010-Q1 | 9.4 | 9.0 |
| 2010-Q2 | 9.3 | 8.9 |
| 2010-Q3 | 9.2 | 8.8 |
| 2010-Q4 | 9.2 | 8.8 |
| 2011-Q1 | 9.1 | 8.8 |
| 2011-Q2 | 9.1 | 8.7 |
| 2011-Q3 | 9.2 | 8.8 |
| 2011-Q4 | 9.4 | 9.0 |
| 2012-Q1 | 9.5 | 9.1 |
| 2012-Q2 | 9.7 | 9.3 |
| 2012-Q3 | 9.8 | 9.4 |
| 2012-Q4 | 10.1 | 9.7 |
| 2013-Q1 | 10.3 | 9.9 |
| 2013-Q2 | 10.5 | 10.1 |
| 2013-Q3 | 10.3 | 9.9 |
| 2013-Q4 | 10.1 | 9.8 |
| 2014-Q1 | 10.2 | 9.8 |
| 2014-Q2 | 10.2 | 9.8 |
| 2014-Q3 | 10.3 | 9.9 |
| 2014-Q4 | 10.4 | 10.1 |
| 2015-Q1 | 10.3 | 10.0 |
| 2015-Q2 | 10.5 | 10.2 |
| 2015-Q3 | 10.4 | 10.0 |
| 2015-Q4 | 10.2 | 9.9 |
| 2016-Q1 | 10.2 | 9.9 |
| 2016-Q2 | 10.0 | 9.7 |
| 2016-Q3 | 9.9 | 9.6 |
| 2016-Q4 | 10.0 | 9.7 |
| 2017-Q1 | 9.6 | 9.3 |
| 2017-Q2 | 9.5 | 9.2 |
| 2017-Q3 | 9.5 | 9.2 |
| 2017-Q4 | 9.0 | 8.6 |
| 2018-Q1 | 9.2 | 8.9 |
| 2018-Q2 | 9.1 | 8.8 |
| 2018-Q3 | 9.0 | 8.7 |
| 2018-Q4 | 8.7 | 8.4 |
| 2019-Q1 | 8.7 | 8.4 |
| 2019-Q2 | 8.4 | 8.2 |
| 2019-Q3 | 8.4 | 8.2 |
| 2019-Q4 | 8.1 | 7.8 |
| 2020-Q1 | 7.8 | 7.6 |
| 2020-Q2 | 7.1 | 7.0 |
- Estimation within +/-0.3 point of the level of unemployment rate and of its quarterly variations.
graphiqueILO-unemployment rate

- Estimation within +/-0.3 point of the level of unemployment rate and of its quarterly variations.
- Scope: population of people living in households, people aged 15 years or more.
- Source: INSEE, Labour Force Survey.
tableauILO-unemployment rate
| ILO-unemployment rate (%) | Variation in points over | Thousands | |||
|---|---|---|---|---|---|
| 2020Q1 | 2020Q2 | quarter | year | 2020Q2 | |
| Unemployed persons | 7.8 | 7.1 | -0.7 | -1.3 | 2,043 |
| 15-24 years | 19.2 | 21.0 | 1.8 | 1.8 | 544 |
| 25-49 years | 7.2 | 6.4 | -0.8 | -1.4 | 1,110 |
| 50 years and more | 5.4 | 4.4 | -1.0 | -1.9 | 389 |
| Men | 7.7 | 7.4 | -0.3 | -1.1 | 1,098 |
| 15-24 years | 19.3 | 21.4 | 2.1 | 0.9 | 299 |
| 25-49 years | 6.9 | 6.6 | -0.3 | -0.9 | 585 |
| 50 years and more | 5.4 | 4.7 | -0.7 | -1.7 | 214 |
| Women | 7.9 | 6.8 | -1.1 | -1.6 | 945 |
| 15-24 years | 19.2 | 20.5 | 1.3 | 3.0 | 245 |
| 25-49 years | 7.5 | 6.3 | -1.2 | -1.8 | 525 |
| 50 years and more | 5.5 | 4.0 | -1.5 | -2.2 | 175 |
| Long-term unemployed persons | 3.0 | 2.2 | -0.8 | -1.1 | 620 |
- Scope : population of people living in households, people aged 15 years or more in France excluding Mayotte
- Source: INSEE, Labour Force Survey
As the main counterpart to the fall in unemployment, the halo of unemployment took off in Q2 2020
Among inactive people as defined by the ILO, 2.5 millions wished to work without being considered as unemployed according to the ILO definition: they made up the halo of unemployment. Their number jumped by 767,000 over a quarter, after an already significant rise in the previous quarter (+44,000). The very large increase in the halo mainly concerned inactive people who declared themselves available for work but not actively looking for work (+709,000). Thus the share of halo in the 15-64 years old population rose by 1.9 points quarter on quarter (+2.2 points year on year) ; to 6,0 %, its highest level since INSEE began measuring it in 2003.
This exceptional increase is the main counterpart to the fall in unemployment. Many of the jobless people wishing to work didn’t actively search for a job due to the confinement of the population and the closures in many sectors. Thus they shifted from unemployment to halo.
As a result of the sharp fall in employment, the increase in the halo more than offset the decline in unemployment. Thus, the share of jobless people aged 15 to 64 wishing to work (both unemployed and in its halo) increased by 1.2 points in the second quarter of 2020, to its highest level since 2016.
tableauPeople in the halo of unemployment.
| Halo of unemployment (in thousands) (left scale) | Share of the population aged 15 to 64 years (in %) (right scale) | |
|---|---|---|
| 2003-Q1 | 1274 | 3.2 |
| 2003-Q2 | 1218 | 3.0 |
| 2003-Q3 | 1309 | 3.3 |
| 2003-Q4 | 1311 | 3.2 |
| 2004-Q1 | 1327 | 3.3 |
| 2004-Q2 | 1342 | 3.3 |
| 2004-Q3 | 1349 | 3.3 |
| 2004-Q4 | 1318 | 3.3 |
| 2005-Q1 | 1293 | 3.2 |
| 2005-Q2 | 1295 | 3.2 |
| 2005-Q3 | 1269 | 3.1 |
| 2005-Q4 | 1273 | 3.1 |
| 2006-Q1 | 1301 | 3.2 |
| 2006-Q2 | 1305 | 3.2 |
| 2006-Q3 | 1290 | 3.1 |
| 2006-Q4 | 1356 | 3.3 |
| 2007-Q1 | 1283 | 3.1 |
| 2007-Q2 | 1303 | 3.1 |
| 2007-Q3 | 1226 | 3.0 |
| 2007-Q4 | 1235 | 3.0 |
| 2008-Q1 | 1259 | 3.0 |
| 2008-Q2 | 1222 | 2.9 |
| 2008-Q3 | 1261 | 3.0 |
| 2008-Q4 | 1242 | 3.0 |
| 2009-Q1 | 1285 | 3.1 |
| 2009-Q2 | 1310 | 3.1 |
| 2009-Q3 | 1343 | 3.2 |
| 2009-Q4 | 1370 | 3.3 |
| 2010-Q1 | 1334 | 3.2 |
| 2010-Q2 | 1364 | 3.3 |
| 2010-Q3 | 1347 | 3.2 |
| 2010-Q4 | 1330 | 3.2 |
| 2011-Q1 | 1389 | 3.3 |
| 2011-Q2 | 1409 | 3.4 |
| 2011-Q3 | 1421 | 3.4 |
| 2011-Q4 | 1418 | 3.4 |
| 2012-Q1 | 1406 | 3.4 |
| 2012-Q2 | 1377 | 3.3 |
| 2012-Q3 | 1430 | 3.4 |
| 2012-Q4 | 1407 | 3.4 |
| 2013-Q1 | 1375 | 3.3 |
| 2013-Q2 | 1389 | 3.3 |
| 2013-Q3 | 1430 | 3.4 |
| 2013-Q4 | 1453 | 3.4 |
| 2014-Q1 | 1495 | 3.5 |
| 2014-Q2 | 1459 | 3.5 |
| 2014-Q3 | 1540 | 3.7 |
| 2014-Q4 | 1533 | 3.6 |
| 2015-Q1 | 1603 | 3.8 |
| 2015-Q2 | 1557 | 3.7 |
| 2015-Q3 | 1532 | 3.7 |
| 2015-Q4 | 1536 | 3.7 |
| 2016-Q1 | 1568 | 3.7 |
| 2016-Q2 | 1615 | 3.9 |
| 2016-Q3 | 1611 | 3.9 |
| 2016-Q4 | 1598 | 3.8 |
| 2017-Q1 | 1630 | 3.9 |
| 2017-Q2 | 1615 | 3.8 |
| 2017-Q3 | 1559 | 3.7 |
| 2017-Q4 | 1609 | 3.8 |
| 2018-Q1 | 1623 | 3.8 |
| 2018-Q2 | 1612 | 3.8 |
| 2018-Q3 | 1611 | 3.8 |
| 2018-Q4 | 1615 | 3.8 |
| 2019-Q1 | 1531 | 3.6 |
| 2019-Q2 | 1598 | 3.8 |
| 2019-Q3 | 1632 | 3.8 |
| 2019-Q4 | 1698 | 4.0 |
| 2020-Q1 | 1742 | 4.1 |
| 2020-Q2 | 2509 | 6.0 |
graphiquePeople in the halo of unemployment.
- Scope: population of people living in households in France excluding Mayotte, people aged 15 years or over
- Source: INSEE, Labour Force Survey
The employment rate fell drastically in Q2 2020, especially for youths
On average the employment rate of the population aged 15-64 years decreased by 1.6 points in Q2, to 64.4 %, after a stability in the previous quarter. It reached its lowest level since the beginning of 2017. It decreased for all age and sex groups. The decline was particularly marked for young people (−2.9 points, to 26.6%) whose employment rate reached a historical low since INSEE began measuring it (1975). The decrease was more pronounced for men (−2.0 points) than women (−1.2 points).
The definition of employment in the Labour Force survey refers to the criteria of the International Labour Office (ILO). Employment includes people who have worked at least one paid hour during a given period, but also people who have not worked for several reasons (paid leave, sick leave, short-time working... - in some cases, subject to conditions of duration). In this period of health crisis, a record number of employees have found themselves in a situation of partial unemployment or sick leave or childcare leave. They are still considered as employed.
tableauEmployment rate by age group
| 15-24 years old (right scale) | 25-49 years old (left scale) | 50-64 years old (left scale) | |
|---|---|---|---|
| 2003-Q1 | 31.6 | 80.5 | 53.5 |
| 2003-Q2 | 30.6 | 80.3 | 53.3 |
| 2003-Q3 | 30.5 | 80.4 | 53.0 |
| 2003-Q4 | 30.0 | 80.4 | 53.1 |
| 2004-Q1 | 30.2 | 80.3 | 53.2 |
| 2004-Q2 | 29.9 | 80.6 | 53.1 |
| 2004-Q3 | 30.3 | 80.3 | 53.6 |
| 2004-Q4 | 30.1 | 80.3 | 53.8 |
| 2005-Q1 | 29.5 | 80.5 | 54.0 |
| 2005-Q2 | 30.6 | 80.3 | 53.8 |
| 2005-Q3 | 29.5 | 80.6 | 53.4 |
| 2005-Q4 | 29.8 | 80.5 | 53.0 |
| 2006-Q1 | 29.1 | 80.6 | 53.2 |
| 2006-Q2 | 29.4 | 80.7 | 52.9 |
| 2006-Q3 | 29.7 | 81.2 | 53.1 |
| 2006-Q4 | 29.5 | 81.3 | 53.4 |
| 2007-Q1 | 29.9 | 81.4 | 53.1 |
| 2007-Q2 | 30.2 | 81.6 | 53.2 |
| 2007-Q3 | 31.0 | 81.7 | 53.2 |
| 2007-Q4 | 31.3 | 82.3 | 53.1 |
| 2008-Q1 | 31.4 | 82.8 | 53.0 |
| 2008-Q2 | 30.7 | 83.0 | 52.9 |
| 2008-Q3 | 30.7 | 82.9 | 53.0 |
| 2008-Q4 | 30.7 | 82.8 | 53.4 |
| 2009-Q1 | 30.6 | 81.9 | 53.5 |
| 2009-Q2 | 30.1 | 81.6 | 53.7 |
| 2009-Q3 | 29.6 | 81.5 | 53.1 |
| 2009-Q4 | 29.5 | 81.3 | 53.1 |
| 2010-Q1 | 30.0 | 81.5 | 53.6 |
| 2010-Q2 | 29.7 | 81.4 | 53.8 |
| 2010-Q3 | 29.1 | 81.5 | 54.2 |
| 2010-Q4 | 29.6 | 81.1 | 54.0 |
| 2011-Q1 | 29.1 | 81.3 | 54.2 |
| 2011-Q2 | 29.4 | 81.1 | 54.3 |
| 2011-Q3 | 29.2 | 80.7 | 54.8 |
| 2011-Q4 | 28.6 | 80.6 | 55.5 |
| 2012-Q1 | 28.4 | 80.3 | 56.1 |
| 2012-Q2 | 28.2 | 80.3 | 56.6 |
| 2012-Q3 | 28.0 | 80.2 | 57.0 |
| 2012-Q4 | 27.8 | 80.2 | 57.5 |
| 2013-Q1 | 27.9 | 79.8 | 57.2 |
| 2013-Q2 | 27.8 | 80.0 | 57.3 |
| 2013-Q3 | 27.9 | 80.2 | 57.5 |
| 2013-Q4 | 28.1 | 80.0 | 57.7 |
| 2014-Q1 | 28.0 | 80.0 | 58.0 |
| 2014-Q2 | 27.8 | 79.8 | 58.4 |
| 2014-Q3 | 27.6 | 79.5 | 58.6 |
| 2014-Q4 | 27.2 | 79.5 | 59.0 |
| 2015-Q1 | 28.0 | 79.3 | 59.1 |
| 2015-Q2 | 27.8 | 79.3 | 59.5 |
| 2015-Q3 | 28.1 | 79.4 | 59.7 |
| 2015-Q4 | 28.1 | 79.5 | 59.6 |
| 2016-Q1 | 28.0 | 79.6 | 60.1 |
| 2016-Q2 | 28.2 | 79.6 | 60.3 |
| 2016-Q3 | 27.5 | 79.9 | 60.6 |
| 2016-Q4 | 28.2 | 79.5 | 60.5 |
| 2017-Q1 | 28.1 | 79.6 | 60.6 |
| 2017-Q2 | 28.5 | 80.3 | 61.3 |
| 2017-Q3 | 28.8 | 80.1 | 61.1 |
| 2017-Q4 | 29.4 | 80.4 | 61.9 |
| 2018-Q1 | 29.1 | 80.4 | 62.0 |
| 2018-Q2 | 29.5 | 80.5 | 62.0 |
| 2018-Q3 | 29.9 | 80.6 | 62.3 |
| 2018-Q4 | 30.4 | 80.7 | 62.3 |
| 2019-Q1 | 29.8 | 80.8 | 62.4 |
| 2019-Q2 | 29.7 | 80.9 | 62.5 |
| 2019-Q3 | 29.4 | 80.7 | 62.3 |
| 2019-Q4 | 29.5 | 81.4 | 63.4 |
| 2020-Q1 | 29.5 | 81.5 | 63.5 |
| 2020-Q2 | 26.6 | 79.7 | 63.0 |
graphiqueEmployment rate by age group
- Scope: population of people living in households in France excluding Mayotte, people aged 15-64 years.
- Source: INSEE, Labour Force Survey.
Underemployment jumped to an unprecedented level as a result of partial unemployment
Usually, underemployment mainly concerns part-time working people who wish to work more. In Q2 2020, underemployment jumped to 20.0% of employed people (+12.0 points), an unprecedented level since INSEE began measuring it in 1990. This increase directly results from to the very large rise in the number of employed people (part-time or full-time work) who declared days off due to partial unemployment, as part of the exceptional partial activity framework aimed at keeping people in employment.
The increase in the share of underemployment affects both women (+11.8 points, to 21.4%) and men (+12.3 points to 18.7%).
Underemployment and partial unemployment are measured on average over the whole second quarter. Consequently, they only partly reflect their even stronger increase in the first half of the quarter. For more information on the effects of the health crisis on these indicators, please refer to the information note associated to this publication (in French).
graphiqueILO underemployment rate
- Champ : France excluding Mayotte, employed people from households, aged 15 and over.
- Source : Insee, Labour Force survey.
All in all, nearly one in three labour market participants (active people or people in the halo around unemployment) was constrained in his labour supply by either a lack of employment (unemployed or in the halo around unemployment) or a situation of underemployment. This share jumped by 11.8 points to 31.7%.
graphiqueFrom unemployment to labour market supply constraint: shares among participants (employment, unemployment, halo) in the labour market
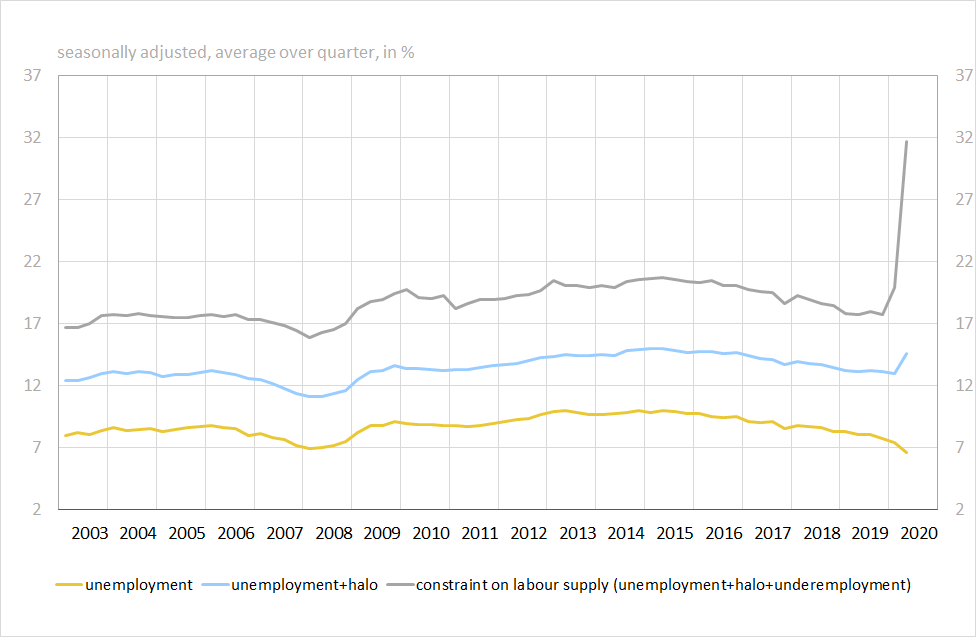
- Champ : France excluding Mayotte, people from households, aged 15 and over.
- Source : Insee, Labour Force survey.
As a consequence of the sharp increase in the number of days of absence from work, mainly due to partial unemployment, average number of hours worked per week and job declined by 12.9% over the quarter, after a 4.8% decrease in Q1. Year-on-year, it collapsed by 18.0%.
graphiqueAverage number of worked hours per week and job
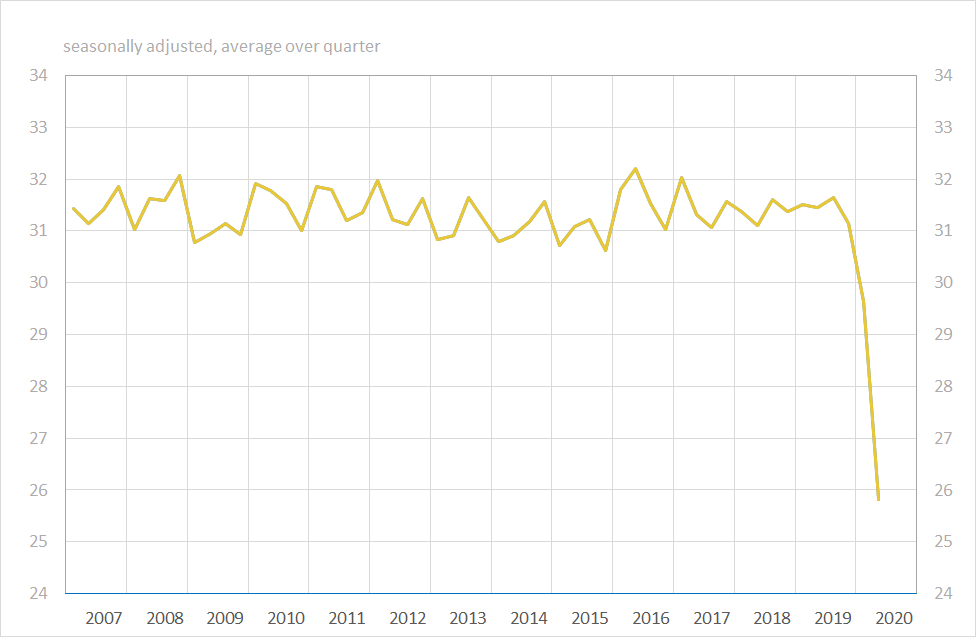
- Champ : metropolitan France, employed people from households, aged 15 to 64.
- Source : Insee, Labour Force survey.
Full-time and part-time employment rates decreased together
Full-time employment rate stood at 53.5% in Q2 2020. It fell back by 1.2 points over a quarter and 0.7 points over a year. Part-time employment rate decreased more modestly by 0.4 points, to 10.9 %. It returned to its lowest level since 2009.
Fixed-term or temporary employment rate sharply dropped
Permanent employment rate for people aged 15 to 64 stood at 49.2% in Q2 2020. It fell by 0.3 points over the quarter, after a virtual stability (+0.1 points) in Q1. Year-on-year, it was virtually stable (−0.1 points). Mainly, the non-renewal of fixed-term contracts during the containment period led to a significant decline in the fixed-term or temporary employment rate, which fell by 1.2 points over the quarter and 1.1 points over a year. Mid-2020 it was 6.4%, 1.7 points below its peak at the end of 2017.
tableauILO employment rate in the population aged 15-64 years
| % of people in the age group | Variation in over | |||
|---|---|---|---|---|
| 2020Q1 | 2020Q2 | quarter | year | |
| Employed people | 66.0 | 64.4 | -1.6 | -1.2 |
| by sex | ||||
| Men | 69.4 | 67.4 | -2.0 | -1.4 |
| Women | 62.7 | 61,5 | -1.2 | -0.9 |
| by age | ||||
| 15-24 years | 29.5 | 26.6 | -2.9 | -3.1 |
| 25-49 years | 81.5 | 79.7 | -1.8 | -1,2 |
| 50-64 years | 63.5 | 63.0 | -0.5 | 0.5 |
| Included : 55-64 years | 54.0 | 53.3 | -0,7 | 0.4 |
| by type of employment contract | ||||
| Permanent employment | 49.5 | 49.2 | -0.3 | -0.1 |
| Fixed-term and temporary employment | 7.6 | 6.4 | -1,2 | -1.1 |
| Other types of employment | 8.9 | 8.9 | 0,0 | 0.2 |
| by contractual working time | ||||
| Full-time employment | 54.7 | 53.5 | -1.2 | -0.7 |
| Part-time employment | 11.3 | 10.9 | -0.4 | -0.4 |
| Full-time equivalent employment rate | 61.5 | 60.0 | -1.5 | -0.9 |
- Scope: population of people living in households in France excluding Mayotte, people aged 15-64 years
- Source: INSEE, Labour Force Survey
The activity rate collapsed in Q2 2020
The activity rate of people aged 15-64 reached its lowest level since 2007. It fell by 2,3 points over a quarter, after a slight decrease in the previous quarter (−0.2 points). This drop concerned all age and sex groups. It is more pronounced for young people (−3.0 points), particularly young men (−3.5 points), and for people aged 25 to 49 (− 2,6 points).
This average decline over the quarter was the result of both the decrease in the employment rate and the shift from unemployment (labour force participation) to the halo around unemployment (inactivity).
tableauILO activity rate in the population aged 15-64 years
| % of people in the age group | Variation in points over | |||
|---|---|---|---|---|
| 2020Q1 | 2020Q2 | quarter | year | |
| Active people | 71.7 | 69.4 | -2.3 | -2.3 |
| by sex | ||||
| Men | 75.3 | 72.9 | -2.4 | -2.4 |
| Women | 68.2 | 66.1 | -2.1 | -2.1 |
| by age | ||||
| 15-24 years | 36.6 | 33.6 | -3.0 | -3.2 |
| 25-49 years | 87.8 | 85.2 | -2.6 | -2.6 |
| 50-64 years | 67.2 | 65.9 | -1.3 | -1.0 |
| Included : 55-64 years | 57.3 | 55.9 | -1.4 | -0.9 |
- Scope: population of people living in households in France excluding Mayotte, people aged 15-64 years
- Source: INSEE, Labour Force Survey
Revisions
Compared to the first estimate published on 14 May 2020, ILO unemployment rate in Q1 2020 was unchanged, at 7.8 %.
For more information
An unemployed person according to the International Labour Office (ILO) is someone aged 15 or more who is not employed during the reference week, is available to work within two weeks and looked actively for a job in the previous month (or has found a job beginning in less than three months).
Next issue: 10 November 2020 at 07.30 am
Pour en savoir plus
