


 21 December 2018
2018- n° 344Household consumption expenditure on goods declined slightly in November (−0.3%) Household consumption expenditure on goods - November 2018
21 December 2018
2018- n° 344Household consumption expenditure on goods declined slightly in November (−0.3%) Household consumption expenditure on goods - November 2018
In November 2018, household expenditure on goods declined by 0.3% in volume*, after an increase in October (+0.9%). This decline was particularly explained by the decrease in food consumption (−0.5%) and engineered goods purchases (−0.6%). Energy consumption slowed down (+0.7% after +1.5% in October).
In November 2018, household expenditure on goods declined by 0.3% in volume*, after an increase in October (+0.9%). This decline was particularly explained by the decrease in food consumption (−0.5%) and engineered goods purchases (−0.6%). Energy consumption slowed down (+0.7% after +1.5% in October).
graphiqueGraph1 – Total consumption of goods
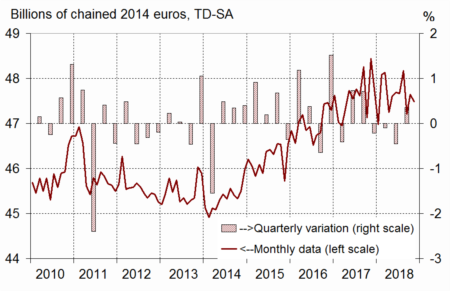
- Source: INSEE

*Volumes are measured at chain-link previous year prices (2014 euro billions) and all figures are trading-day and seasonally adjusted.
Engineered goods: fall in November
In November, spending on engineered goods decreased (−0.6%), after being relatively dynamic in October (+0.8%). In particular, purchases of durable goods fell sharply, while purchases of clothing and other manufactured goods decreased slightly.
Durables: sharp decline in November
Consumption of durable goods declined strongly in November (−1.1%, after +1.0%). This decrease was mainly due to the drop in transport equipment purchases (−1.4% after +1.0%). In particular, sales of demonstration vehicles fell sharply.
Textile-clothing: slight decrease in November
Expenditure on textile-clothing decreased slightly in November (−0.1% after +1.2%). Purchases of fabric and clothes decreased sharply, while sales of shoes and leather goods increased.
Other engineered goods: virtual stability
In November, consumption of "other manufactured goods" was virtually stable (−0.1% after +0.2% in October and −0.2% in September).
graphiqueGraph2 – Breakdown of engineered goods
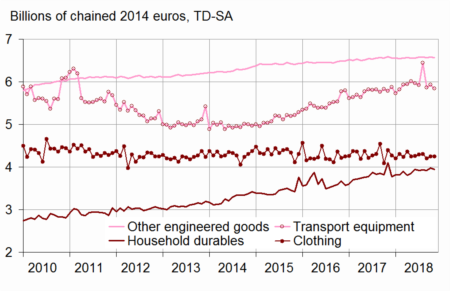
- Source: INSEE
Food products: decrease in November
In November, food consumption decreased (−0.5% after +0.9% in October). This decline came from the decrease in agri-food products, despite a slight increase in the consumption of fresh fruits and vegetables.
graphiqueGraph3 – Food products, engineered goods and energy
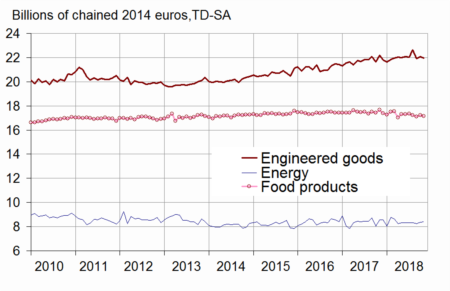
- Source: INSEE
Energy: slowdown in November
In November, energy consumption slowed down (+0.7% after +1.5% in October). Fuel consumption declined (−1.0% after +4.4% in October), but gas and electricity consumption bounced back (+2.1% after −0.9%).
graphiqueGraph4 – Breakdown of energy
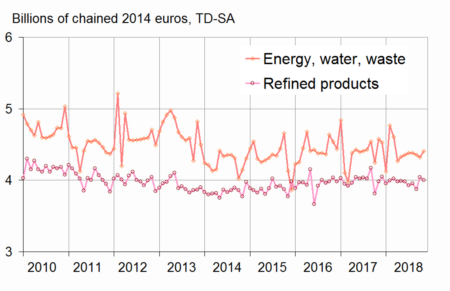
- Source: INSEE
The variation in October 2018 was revised upwards
Compared to the previous estimation, the change of household expenditure on goods in October 2018 was revised upwards: +0.9% instead of +0.8%. Indeed, new information has been integrated and the seasonal adjustment coefficients have been updated.
tableauTable – Household consumption expenditure on goods
| Weight (1) | Sept-18 | Oct-18 | Nov-18 | Nov 18 / Nov 17 | Q / Q-1 (2) | |
|---|---|---|---|---|---|---|
| Food products | 38 | –0.9 | 0.9 | –0.5 | –3.0 | –0.8 |
| - excl. Tobacco | 34 | –1.0 | 0.9 | –0.5 | –2.4 | –0.8 |
| Engineered goods | 45 | –3.2 | 0.8 | –0.6 | –1.2 | –1.2 |
| - Durables | 22 | –5.1 | 1.0 | –1.1 | –0.9 | –1.9 |
| Including : | ||||||
| - Transport equipment | 12 | –8.9 | 1.0 | –1.4 | 1.0 | –3.8 |
| - Household durables | 7 | –0.2 | 1.4 | –1.0 | –4.0 | 0.4 |
| - Textile-clothing | 9 | –2.5 | 1.2 | –0.1 | –3.4 | –1.2 |
| - Other engineered goods | 14 | –0.2 | 0.2 | –0.1 | –0.2 | 0.0 |
| Energy | 18 | –1.2 | 1.5 | 0.7 | –1.9 | 0.1 |
| - Energy, water, waste | 10 | –0.6 | –0.9 | 2.1 | –3.6 | –0.2 |
| - Refined Products | 8 | –2.1 | 4.4 | –1.0 | 0.6 | 0.5 |
| Total | 100 | –2.0 | 0.9 | –0.3 | –2.0 | –0.8 |
| - Including Manufactured goods | 84 | –2.1 | 1.1 | –0.6 | –1.6 | –0.8 |
- (1) Weighting in the consumption expenditure on goods in value in 2017
- (2) Last three months / previous three months
- Source: INSEE
Documentation
Methodology (pdf,23 Ko)
Pour en savoir plus
