


 9 November 2018
2018- n° 294In Q3 2018, tourist collective accommodation attendance increased more moderately
(+1,1 % over one year, after +1,7 % in the previous quarter) Tourism occupancy in hotels, campsites and holiday and other short-stay accommodation
in metropolitan France - third quarter 2018
9 November 2018
2018- n° 294In Q3 2018, tourist collective accommodation attendance increased more moderately
(+1,1 % over one year, after +1,7 % in the previous quarter) Tourism occupancy in hotels, campsites and holiday and other short-stay accommodation
in metropolitan France - third quarter 2018
November 12, 2018: The supplementary data file has been updated since the publication of November 9, 2018; Comments are on data available at 9/11. In Q3 2018, throughout metropolitan France, the number of overnight stays in tourist collective accommodation was up by 1.1% compared to the same period of 2017. This increase reached 1.7% the revious quarter. Thus, after the clear dynamics of 2017, attendance returned to a moderate growth pace. As in previous quarter, the number of overnight stays was driven by non-resident (+4.6%),while the numbers of residents fell (−0.5%).
In hotels, the number of overnight stays of non-resident grew strongly
In Q3 2018, attendance in hotels increased by 2.1% compared to the same quarter of 2017 (after +1.3% in the previous quarter).
Occupancy was similar in chain hotels and independent hotels. The rise was particularly marked in the high-end (+6.6% in 4 or 5 stars).
Attendance of non-residents speeded up (7.2% after 5.9% in the second quarter), that of residents was down for the second consecutive quarter (−1.2%, after −1.3%). Thus, the dynamic gap between the two customers was important and concerned all spaces.
Occupancy in hotels rose most in Île-de-France (+7.1%), more than in mountains (+1.9%) and in coastlines (1.4%). It was stabl in provincial urban area and decreased in other area (middle montain areas and rural areas).
Tourist numbers in metropolitan France was only driven by non-resident
In Q3 2018, throughout metropolitan France, the number of overnight stays in tourist collective accommodation was up by 1.1% compared to the same period of 2017. This increase reached 1.7% the revious quarter. Thus, after the clear dynamics of 2017, attendance returned to a moderate growth pace. As in previous quarter, the number of overnight stays was driven by non-resident (+4.6%),while the numbers of residents fell (−0.5%).
In hotels, the number of overnight stays of non-resident grew strongly
In Q3 2018, attendance in hotels increased by 2.1% compared to the same quarter of 2017 (after +1.3% in the previous quarter).
Occupancy was similar in chain hotels and independent hotels. The rise was particularly marked in the high-end (+6.6% in 4 or 5 stars).
Attendance of non-residents speeded up (7.2% after 5.9% in the second quarter), that of residents was down for the second consecutive quarter (−1.2%, after −1.3%). Thus, the dynamic gap between the two customers was important and concerned all spaces.
Occupancy in hotels rose most in Île-de-France (+7.1%), more than in mountains (+1.9%) and in coastlines (1.4%). It was stabl in provincial urban area and decreased in other area (middle montain areas and rural areas).
graphiqueGraph1 – Overnight stays in hotels
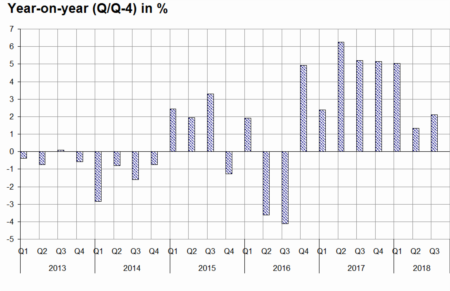
- Source: INSEE, in partnership with the Regional Committees of tourism (CRT) and DGE
Occupancy in Holiday and other short-stay accommodation was marking time
Attendance at holiday and other short stay accomodation (HOSSA) declined slightly compared to the same quarter of 2017 (−0.7% year-on-year).
It was still buoyant in the second quarter (3.7%). Unlike hotels and campsites, non-resident customers was lacking (−1.4% over one year), after more than one yeay of continous growth. Furthermore, occupancy of customers living in France slightly weakened. The rise in overnight stays remained very strong in Île-de-France (+20.2%), more marked than provincial urban area (+3.7%) and the other spaces.
On the other hand, occupancy fell back on coastlines and especially fell in mountain areas (−12.4% over one year), both resident and non-resident customers.
graphiqueGraph2 – Overnight stays in HOSSA
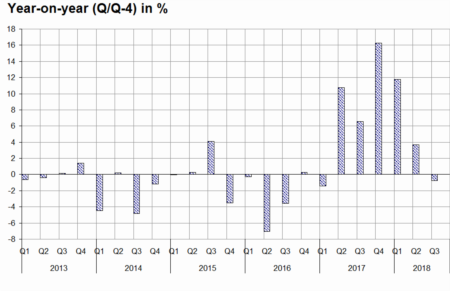
- Source: INSEE, in partnership with the Regional Committees of tourism (CRT) and DGE
Occupancy in campsites continued to increase
Attendance in campsites continued to increase by 1.1% over one year, mainly due to non-resident customers (+3.5%). Growth was driven by high-end campsites (+3.7% in 4 and 5 stars) and essentially concerned pitches with rental accomodation. Occupancy in coastlines (+2.4%) benefitied from very favorable weather conditions in the third quarter and from the contribution of non-residents (+6.9%).
graphiqueGraph3 – Overnight stays in campsites
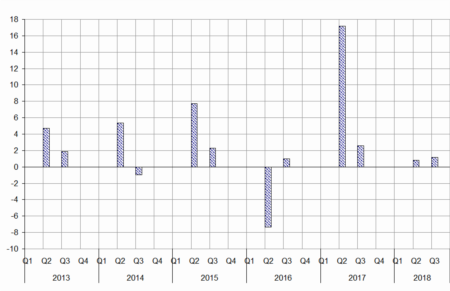
- Source: INSEE, in partnership with the Regional Committees of tourism (CRT) and DGE
Sustained attendance in August and September
Occupancy dropped slightly in July compared to the previous year, due to the absence of a long week end for July 14, late school hollidays and perhaps a football World Cup effect, which would have caused a shift in summer break. On the other hand, the particularly favorable weather conditions increased the overnight stays in august and september, exceeding a year 2017 already record.
Revisions
Compared to the previous publication, the overall variation in the number of overnight stays in Q2 2018 has been lowered (+1.7% instead of +2.1%). It has been lowered for campsites (+0.8% instead of +1.7%), for HOSSA (+3.7% instead of +4.4%) and has been unchanged in hotels.
tableauTable1 – Overnight stays in Q3 2018*
| Nights of the quarter | Year-on-year (%) (Q/Q-4) | ||||
|---|---|---|---|---|---|
| Total nights (millions) | % of foreign nights | Total | Foreign | French | |
| Total | 202.6 | 32.6 | 1.1 | 4.6 | –0.5 |
| Hotels | 69.1 | 41.7 | 2.1 | 7.2 | –1.2 |
| Unclassified | 8.8 | 32.2 | 21.5 | 35.5 | 15.8 |
| 1 and 2 stars | 16.2 | 30.9 | –10.3 | –2.2 | –13.4 |
| 3 stars | 26.3 | 41.2 | 2.5 | 5.5 | 0.4 |
| 4 and 5 stars | 17.8 | 57.1 | 6.6 | 7.9 | 4.9 |
| hotel chain | 32.3 | 43.2 | 2.0 | 7.2 | –1.7 |
| independent hotel | 36.8 | 40.5 | 2.3 | 7.2 | –0.8 |
| Ile de France | 19.6 | 65.0 | 7.1 | 11.3 | 0.1 |
| Provincial urban area | 24.4 | 33.1 | 0.1 | 4.2 | –1.8 |
| Coastlines | 15.2 | 35.3 | 1.4 | 5.6 | –0.8 |
| Ski mountain area | 2.3 | 28.4 | 1.9 | 8.0 | –0.3 |
| Other area | 7.6 | 26.4 | –1.8 | –0.8 | –2.2 |
| Holiday and other short-stay accomodation | 36.6 | 17.7 | –0.7 | –1.4 | –0.6 |
| Tourism residences | 25.7 | 21.0 | 1.7 | –4.9 | 3.6 |
| Other | 10.8 | 10.0 | –6.1 | 21.1 | –8.4 |
| Ile de France | 3.3 | 38.1 | 20.2 | 15.1 | 23.5 |
| Provincial urban area | 6.0 | 18.4 | 3.7 | –15.6 | 9.3 |
| Coastlines | 15.2 | 15.4 | –2.2 | 0.4 | –2.7 |
| Ski mountain area | 5.5 | 11.1 | –12.4 | –11.4 | –12.6 |
| Other area | 6.5 | 17.7 | 1.3 | 1.5 | 1.3 |
| Campsites | 97.0 | 31.7 | 1.1 | 3.5 | 0.1 |
| Unclassified | 4.2 | 30.5 | –6.3 | –5.9 | –6.5 |
| 1 and 2 stars | 12.0 | 26.5 | –4.6 | –0.4 | –6.1 |
| 3 stars | 30.6 | 31.2 | 0.6 | 1.5 | 0.2 |
| 4 and 5 stars | 50.1 | 33.4 | 3.7 | 6.2 | 2.4 |
| bare pitches | 47.5 | 41.1 | –1.5 | 1.5 | –3.4 |
| pitches with rental accommodation | 49.5 | 22.8 | 3.8 | 3.8 | 2.8 |
| coastlines | 54.9 | 26.7 | 2.4 | 6.9 | 0.9 |
| except coast | 42.0 | 38.4 | –0.5 | 0.6 | –1.1 |
- Reference area : Metropolitan France
- *provisional data
- Source: INSEE, in partnership with the Regional Committees of tourism (CRT) and DGE
Pour en savoir plus
Time series: Tourism
