


 30 October 2018
2018- n° 289Household consumption expenditure on goods fell sharply in September (−1.7%) and went
up over the third quarter (+0.6%) Household consumption expenditure on goods - September 2018
30 October 2018
2018- n° 289Household consumption expenditure on goods fell sharply in September (−1.7%) and went
up over the third quarter (+0.6%) Household consumption expenditure on goods - September 2018
In September 2018, household expenditure on goods fell by 1.7% in volume*, after rising in August (+1.1%). This drop was due to the sharp decline in manufactured good consumption (−2.5%), energy spending (−1.2%) and food consumption (−0.9%).
Over the whole third quarter, household consumption expenditure on goods recovered compared with the previous quarter (+0.6% after −0.3%).
- Engineered goods: sharp backlash in September, increase over the quarter
- Durables: very sharp decline in September
- Textile-clothing: slight downturn in September
- Other engineered goods: quasi-stability
- Food products: decrease in September, stability over the quarter
- Energy: slight downturn in September, small rise over the quarter
- The variation in August 2018 was revised upwards
In September 2018, household expenditure on goods fell by 1.7% in volume*, after rising in August (+1.1%). This drop was due to the sharp decline in manufactured good consumption (−2.5%), energy spending (−1.2%) and food consumption (−0.9%).
Over the whole third quarter, household consumption expenditure on goods recovered compared with the previous quarter (+0.6% after −0.3%).
graphiqueGraph1 – Total consumption of goods
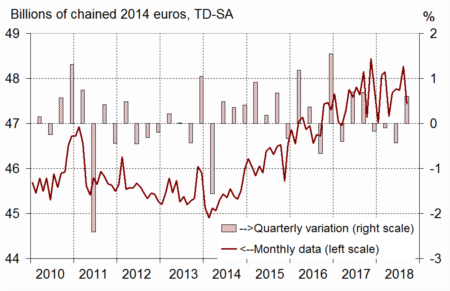
- Source: INSEE

*Volumes are measured at chain-link previous year prices (2014 euro billions) and all figures are trading-day and seasonally adjusted.
Engineered goods: sharp backlash in September, increase over the quarter
In September, expenditure on engineered goods suffered the repercussions of the previous month's strong rise (−2.5% after +2.7% in August), that was partly due to the anticipation of the tightening of the new car approval tests in Europe on September 1st.
Over the whole quarter, expenditure on engineered goods increased again (+1.1% after +1.0%).
Durables: very sharp decline in September
Consumption of durables decreased strongly in September (−4.7% after +5.2%), mainly because of the fall in transport equipement sales (−7.9%), particularly new cars. Expenditure on household durables decreased (−0.3% after +0.5%).
Over the whole quarter, expenditure on durable goods increased for the second consecutive quarter (+1.7% after +1.6%).
Textile-clothing: slight downturn in September
Expenses on textile-clothing fell slightly in September (−0.5% after +0.1%), especially due to the decline in shoe sales.
Over the whole quarter, textile-clothing consumption slowed down (+0.2% after +0.8%).
Other engineered goods: quasi-stability
The consumption of “other engineered goods” was almost stable in September (−0.1%), after several months of limited growth.
Over the whole quarter, expenses in “other engineered goods” increased slightly (+0.5% after +0.2%).
graphiqueGraph2 – Breakdown of engineered goods
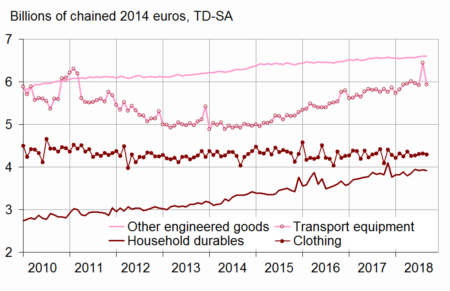
- Source: INSEE
Food products: decrease in September, stability over the quarter
graphiqueGraph3 – Food products. engineered goods and energy
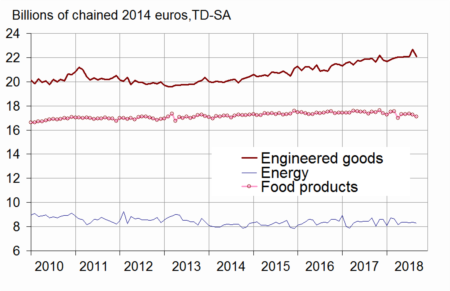
- Source: INSEE
In September, food consumption declined again (−0.9% after −0.5% in August). In particular, consumption of agriculture products decreased significantly. Tobacco consumption declined for the second consecutive month.
Over the whole third quarter, food consumption was practically stable (+0.1%), after two quarters of decline.
Energy: slight downturn in September, small rise over the quarter
graphiqueGraph4 – Breakdown of energy
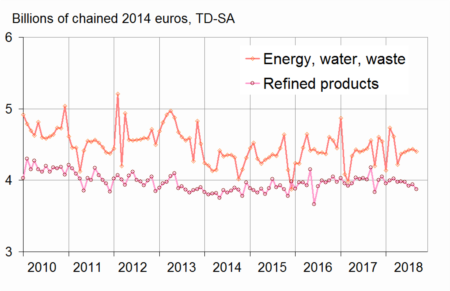
- Source: INSEE
In September, energy consumption fell back (−1.2% after +0.4% in August). Gas and electricity consumption decreased (−0.6%), as well as refined products spending (–1.8%)
Over the quarter, expenses on energy increased slightly (+0.4% after −2.2%).
The variation in August 2018 was revised upwards
Compared to the previous estimation, the change of household expenditure on goods in August 2018 was revised upwards: +1.1% instead of +0.8%. Indeed, new information has been integrated and the seasonal adjustment coefficients have been updated.
tableauTable – Household consumption expenditure on goods
| Weight (1) | July 2018 | Aug 2018 | sept-18 | Sept 18 / Sept 17 | Q3 / Q2 (2) | |
|---|---|---|---|---|---|---|
| Food products | 38 | 0.1 | –0.5 | –0.9 | –2.4 | 0.1 |
| - excl. Tobacco | 34 | 0.1 | –0.6 | –1.0 | –1.7 | 0.1 |
| Engineered goods | 45 | –0.1 | 2.7 | –2.5 | 0.7 | 1.1 |
| - Durables | 22 | –0.7 | 5.2 | –4.7 | 2.3 | 1.7 |
| Including : | ||||||
| - Transport equipment | 12 | –0.8 | 8.7 | –7.9 | 3.1 | 2.1 |
| - Household durables | 7 | –0.8 | 0.5 | –0.3 | 1.7 | 1.4 |
| - Textile-clothing | 9 | 0.8 | 0.1 | –0.5 | –2.9 | 0.2 |
| - Other engineered goods | 14 | 0.4 | 0.3 | –0.1 | 0.6 | 0.5 |
| Energy | 18 | –0.3 | 0.4 | –1.2 | –5.2 | 0.4 |
| - Energy, water, waste | 10 | 0.7 | 0.2 | –0.6 | –3.4 | 2.2 |
| - Refined Products | 8 | –1.4 | 0.7 | –1.8 | –7.3 | –1.7 |
| Total | 100 | 0.0 | 1.1 | –1.7 | –1.5 | 0.6 |
| - Including Manufactured goods | 84 | –0.1 | 1.4 | –1.7 | –0.8 | 0.6 |
- (1) Weighting in the consumption expenditure on goods in value in 2017
- (2) Last three months / previous three months
- Source: INSEE
Documentation
Methodology (pdf,23 Ko)
Pour en savoir plus
