


 11 October 2018
2018- n° 268In September 2018, consumer prices edged down by 0.2% over one month and rose by 2.2%
year on year Consumer price index - final results - September 2018
11 October 2018
2018- n° 268In September 2018, consumer prices edged down by 0.2% over one month and rose by 2.2%
year on year Consumer price index - final results - September 2018
In September 2018, the Consumer Prices Index (CPI) fell back by 0.2% over a month, after a 0.5% rebound in August. This downturn resulted from that, seasonal, in services prices (−1.5% after +0.3%). Contrariwise, manufactured product prices gathered pace (+1.3% after +1.1%) after the end of summer sales in August in the metropolitan area. Food prices were also more dynamic than in the previous month (+0.6% after +0.3%). Finally, energy prices rose by 0.9% over a month after a stability in August.
Monthly change: −0,2 % in September; Year-on-year change: +2.2%
In September 2018, the Consumer Prices Index (CPI) fell back by 0.2% over a month, after a 0.5% rebound in August. This downturn resulted from that, seasonal, in services prices (−1.5% after +0.3%). Contrariwise, manufactured product prices gathered pace (+1.3% after +1.1%) after the end of summer sales in August in the metropolitan area. Food prices were also more dynamic than in the previous month (+0.6% after +0.3%). Finally, energy prices rose by 0.9% over a month after a stability in August.
Seasonally adjusted, consumer prices rose by 0.1% over a month, as in the previous month.
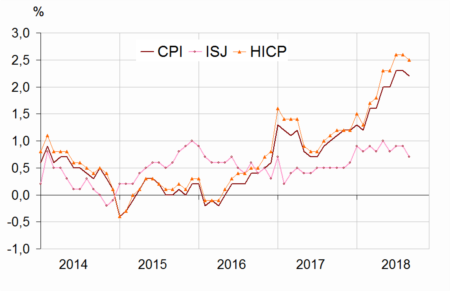
Year on year, consumer prices rose by 2.2%, after +2.3% in August. This slight drop in inflation came from a year-on-year slowdown in services and energy prices and a slightly more marked drop in those of manufactured product. Contrariwise, a sharp acceleration in fresh food prices limited the drop in inflation.
Slowdown in core inflation year on year
Year on year, core inflation slowed down: +0.7% after +0.9%. The Harmonised Index of Consumer Prices (HICP) edged down by 0.2% after +0.5% in August; year on year, it grew by 2.5%, after +2.6% in the previous month.
Slight drop in energy inflation
In September 2018, energy inflation dropped for the second consecutive month (+12.8% year on year after +13.0% in August). The prices of petroleum products decelerated (+19.5% year on year after +20.1%): over a month, they gathered pace by 1.5%, but the rise was less pronounced than in September 2017 (+2.1%). Gas prices accelerated again (+20.7% year on year after +19.8%).
tableauTable1 – Detailed figures for various groups
| Items | Weight | Index | Percentage change | |
|---|---|---|---|---|
| 2018 | Sept. 2018 | m-on-m change(2) | y-on-y change(3) | |
| a) All households | ||||
| Overall | 10000 | 103.56 | −0.2 | 2.2 |
| Overall SA(1) | 10000 | 103.61 | 0.1 | 2.2 |
| Food | 1627 | 104.46 | 0.6 | 2.8 |
| Fresh food | 243 | 117.15 | 3.8 | 11.2 |
| Other food | 1384 | 102.41 | 0.0 | 1.4 |
| Tobacco | 193 | 119.80 | 0.0 | 16.8 |
| Manufactured products | 2594 | 99.30 | 1.3 | −0.2 |
| Clothing and footwear | 416 | 104.01 | 8.4 | 0.5 |
| Medical products | 425 | 92.59 | 0.0 | −2.3 |
| Other manufactured products | 1753 | 99.89 | 0.1 | 0.1 |
| Energy | 777 | 115.32 | 0.9 | 12.8 |
| Petroleum products | 408 | 123.01 | 1.5 | 19.5 |
| Services | 4809 | 103.14 | −1.5 | 1.1 |
| Actual rentals and services for dwellings | 764 | 100.77 | 0.0 | −0.3 |
| Health services | 617 | 102.49 | 0.2 | 0.7 |
| Transport | 282 | 98.18 | −10.2 | −0.5 |
| Communication | 223 | 96.11 | −0.6 | −2.0 |
| Other services | 2923 | 104.96 | −1.4 | 1.9 |
| Total except rents and tobacco | 9192 | 103.49 | −0.2 | 2.1 |
| Total except tobacco | 9807 | 103.25 | −0.2 | 1.9 |
| b) Urban working-class households or households of employees | ||||
| All products excluding tobacco | 9706 | 103.03 | 0.0 | 1.8 |
| c) Households that belong to the lowest equivalized disposable income quintile - France | ||||
| All products excluding tobacco | 9700 | 102.80 | −0.1 | 1.8 |
- (1) seasonally adjusted
- (2) [m/(m-1)]
- (3) [m/(m-12)]
- Geographical coverage: France excluding Mayotte
- Source: INSEE - Consumer Price Indices
Slowdown in services inflation
Year on year, services prices were less dynamic than in the previous month (+1.1% after +1.3%). Transport prices fell back by 0.5% year on year after +1.9%, due to a drop in airfares (−0.9% year on year after +3.5%). After the end of summer school holidays, accommodation services prices slowed down: +4.7% year on year, after +6.9% in August. The drop in communication services prices was accentuated in September (−2.0% after −0.9%), due to promotional offers. Finally, the prices of actual rentals and of services for dwellings decreased by 0.3%, as in July and August and health services prices rose by 0.7% year on year, as in August.
Sharper drop in manufactured product prices year on year
Year on year, manufactured product prices dropped by 0.2%, after −0.1% in the previous month. Clothing and footwear prices were less dynamic (+0.5% year on year in September after +0.8%), the acceleration over a month being less sharp than in September 2017. The prices of “other manufactured products” slowed down too (+0.1% year on year after +0.2%): the motor cars prices decelerated (+1.8% year on year after +2.6%) whereas those in glassware, tableware and household ustensils sharply gathered pace (+1.2% after +0.1%) and those in furnitures and furnishings dropped less than in August (−0.5% year on year after −0.7%). Moreover, health product prices decreased by 2.3% year on year, after −2.2% in August.
Further acceleration in food prices
In September 2018, food prices accelerated: +2.8% over a year, after +2.2% in the previous month. The prices of fresh products ramped up (+11.2% year on year after +6.9%), because of a much marked acceleration in those of fresh vegetables (+20.8% after +9.8%). Excluding fresh products, food prices rose by 1.4% over a year in September as in August.
graphiqueGraph1 – Consumer Price Index (CPI), core inflation (ISJ)(1) and Harmonised Index of Consumer Prices (HICP)(2) year-on-year changes
tableauTable2 – Detailed figures for Core inflation(1) and HICP(2)
| Items | Weight | Index | Percentage change | |
|---|---|---|---|---|
| 2018 | Sept. 2018 | m-on-m change(3) | y-on-y change(4) | |
| Core inflation - All items | 6041 | 101.89 | −0.2 | 0.7 |
| Food excluding fresh products, meat, milk and exotic products | 740 | 101.69 | 0.2 | 1.0 |
| Manufactured products | 2125 | 99.78 | −0.1 | 0.1 |
| Services including actual rentals and services for dwellings | 3176 | 103.38 | −0.3 | 1.0 |
| HICP - All items | 104.12 | −0.2 | 2.5 | |
- (1) Core inflation indicator excludes public sector prices, the most volatile consumer prices and the tax measures. Seasonally adjusted, this index is calculated for all households in France excluding overseas departments and territories. (in French “indice d'inflation sous-jacent - ISJ”)
- (2) HICP: Harmonised Indices of Consumer Prices are inflation figures designed for international comparison between Member states of the European Union. This index is calculated for all households in France excluding Mayotte.
- (3) [m/(m-1)]
- (4) [m/(m-12)]
- Source: INSEE - Consumer Price Indices
Revisions
Compared with the provisional estimates published on September 28, 2018, the month-on-month and year-on-year changes in the CPI and in the HICP are confirmed.
Documentation
Methodology (pdf,141 Ko)
Pour en savoir plus
