


 1 October 2018
2018- n° 234Continuing rise in prices of second-hand dwellings in Q2 2018; steady volume of transactions Notaries-INSEE second-hand dwellings price index - second quarter 2018
1 October 2018
2018- n° 234Continuing rise in prices of second-hand dwellings in Q2 2018; steady volume of transactions Notaries-INSEE second-hand dwellings price index - second quarter 2018
1st October 2018: The file of additionnal data has been updated compared to the publication of the 6 September 2018.
In Q2 2018, prices of second-hand dwellings in France (excluding Mayotte) were still increasing, but in a little less steady way than the previous quarter: +0.5% compared to Q1 2018 (provisional seasonally adjusted results), after +1.1%. Over a year, the rise of prices continued: +2.8% compared to Q2 2017, after +2.9% the quarter before. As observed since the end of 2016, this increase was mainly due to flat prices: +3.3% over the year, against 2.5% for houses.

Warning: the Notaries-INSEE second-hand dwellings prices indices are now published in a new version. Their elaboration is based on a revised and improved method of calculation. The scope has been extended to the overseas departments and is now France (excluding Mayotte). This new method is applied from the revised publication of Q1 2018. The reference is from now on the average in 2015 (against T1 2010 until the publication of T1 2018).
In Q2 2018, prices of second-hand dwellings in France (excluding Mayotte) were still increasing, but in a little less steady way than the previous quarter: +0.5% compared to Q1 2018 (provisional seasonally adjusted results), after +1.1%. Over a year, the rise of prices continued: +2.8% compared to Q2 2017, after +2.9% the quarter before. As observed since the end of 2016, this increase was mainly due to flat prices: +3.3% over the year, against 2.5% for houses.
In Île-de-France, the prices of second-hand dwellings were still dynamic
In Q2 2018, prices of second-hand dwellings in Île-de-France continued to rise: +1.1% compared to Q1 2018, after +0.7%.
Year on year, prices were still increasing, but at a quite slower pace than observed the quarters before: +4.1%, after +4.2% and +4.7%. The rise of the flat prices pursued, with a slight slowdown: +4.8% over a year (+7.1% for flats in Paris), after +5.1%. The annual rise in the house prices in Île-de-France, less strong, remained stable at +2.5% over the year.
Slowdown in the rise of prices of second-hand dwellings in provincial France
In Q2 2018, the rise of prices of second-hand dwelling in provincial France increased by 0.2% compared to the previous quarter, after +1.2%.
Over one year, the prices increased less markedly than in Île-de-France: +2.3% between Q2 2017 and Q2 2018, after +2.4% and 2.6%. For the first time since the beginning of 2017, the annual rise was more important for houses (+2.5%) than for flats (+2.0%).
graphiqueGraphique1a – Variation in prices of second-hand dwellings in France over a year
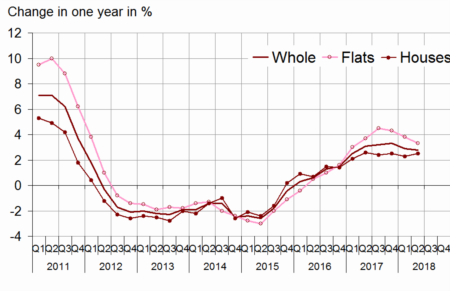
- Scope: France (excluding Mayotte)
- Sources: INSEE, French notaries - Database Bien, Perval society
graphiqueGraphique2a – Prices of second-hand dwellings in metropolitan France
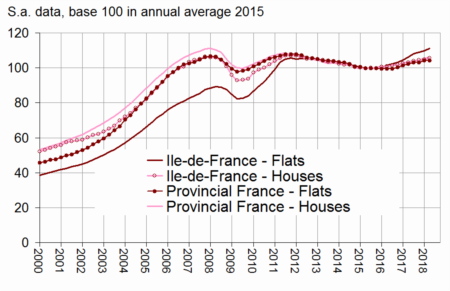
- Scope: metropolitan France
- Sources: INSEE, French notaries - Database Bien, Perval society
tableauTableau1a – Variation in prices of second-hand dwellings in France
| change in | ||||||
|---|---|---|---|---|---|---|
| 3 months (S.A.) | 12 months | |||||
| 2017 Q4 | 2018 Q1 (sd) | 2018 Q2 (p) | 2017 Q4 | 2018 Q1 (sd) | 2018 Q2 (p) | |
| France | 0.3 | 1.1 | 0.5 | 3.3 | 2.9 | 2.8 |
| Flats | 0.5 | 0.8 | 0.6 | 4.3 | 3.8 | 3.3 |
| Houses | 0.2 | 1.2 | 0.4 | 2.5 | 2.3 | 2.5 |
- (p): provisional; (sd): semi-definitive
- Scope: France (excluding Mayotte)
- Sources: INSEE, French notaries - Database Bien, Perval society
The annual volume of transactions was still high
In Q2 2018, the annual volume of transactions remained at a high level: in June, the number of transactions carried out over the last twelve months was 953,000. This volume was similar as the one recorded one quarter earlier (956,000 in March), but remained higher than the one recorded one year earlier (915,000). Compared to the stock of available housing, which increases by around 1% per year, the proportion of transactions was equivalent to what was observed in the early 2000.
graphiqueGraphique3a – Volume of transactions of second-hand dwellings over the last 12 months
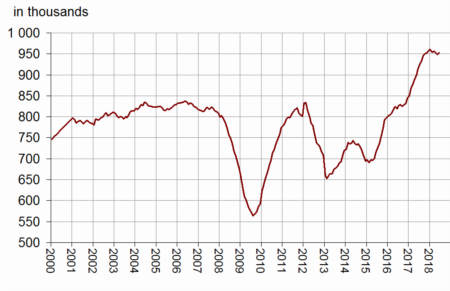
- Scope: France (excluding Mayotte)
- Sources: CGEDD, based on notarial databases and DGFiP (MEDOC)
Revisions
As explained in the warning at the beginning of this publication, the Notaries-INSEE second-hand dwellings prices indices are published in a new version from the revised publication of Q1 2018. Moreover, as usual, the second-hand housing price index is revised to include observations recorded after the previous publication.
In comparison with the results released on 2 July 2018, the change in prices in Q1 2018 has been revised downwards by −0.1 points overall (−0.3 points for flats, no revision for houses). The overall change in prices in Q1 2018 stands at +1.1% compared to Q4 2017, instead of +1.2% (figure updated on 2 July 2018) and +1.5% estimated on 7 June 2018.
tableauTableau2a – Variation in prices of second-hand dwellings in metropolitan France
| Change in | ||||||
|---|---|---|---|---|---|---|
| 3 months (S.A.) | 12 months | |||||
| 2017 Q4 | 2018 Q1 (sd) | 2018 Q2 (p) | 2017 Q4 | 2018 Q1 (sd) | 2018 Q2 (p) | |
| Metropolitan France | 0.4 | 1.1 | 0.5 | 3.3 | 3.0 | 2.8 |
| Île-de-France | 0.7 | 0.7 | 1.1 | 4.7 | 4.2 | 4.1 |
| Provincial France | 0.2 | 1.2 | 0.2 | 2.6 | 2.4 | 2.3 |
| - Auvergne-Rhône-Alpes | 0.1 | 1.1 | ** | 2.8 | 2.5 | ** |
| - Hauts-de-France | 0.2 | 0.1 | ** | 1.5 | 1.0 | ** |
| - Provence-Alpes-Côte d'Azur | -0.9 | 1.8 | ** | 1.1 | 2.0 | ** |
| Flats | 0.5 | 0.9 | 0.6 | 4.3 | 3.8 | 3.3 |
| Île-de-France | 0.7 | 0.9 | 1.1 | 5.6 | 5.1 | 4.8 |
| - Paris | 2.2 | 0.6 | 1.9 | 8.7 | 7.5 | 7.1 |
| - Immediate suburbs | -0.7 | 1.7 | 0.7 | 3.9 | 4.1 | 3.7 |
| - Outer suburbs | -0.1 | 0.1 | -0.1 | 1.2 | 0.7 | 0.9 |
| Provincial France | 0.2 | 0.9 | 0.1 | 3.1 | 2.7 | 2.0 |
| - Conurbation > 10 000 inhabitants | 0.2 | 1.0 | ** | 3.2 | 2.9 | ** |
| * Central town | 0.8 | 0.8 | ** | 4.0 | 3.5 | ** |
| * Suburb | -0.8 | 1.3 | ** | 1.7 | 2.0 | ** |
| - Conurbation < 10 000 inhabitants | 0.4 | 0.1 | ** | 2.5 | 0.8 | ** |
| - Auvergne-Rhône-Alpes | 0.1 | 1.8 | ** | 3.6 | 3.8 | ** |
| * Lyon | 2.4 | 2.0 | ** | 9.6 | 10.3 | ** |
| - Hauts-de-France | -2.0 | 0.0 | ** | -0.1 | 0.0 | ** |
| - Provence-Alpes-Côte d'Azur | -0.9 | 1.4 | ** | 0.8 | 1.6 | ** |
| * Marseille | 1.5 | 1.5 | ** | 5.4 | 2.8 | ** |
| Houses | 0.3 | 1.2 | 0.4 | 2.5 | 2.4 | 2.5 |
| Île-de-France | 0.6 | 0.2 | 0.9 | 2.7 | 2.5 | 2.5 |
| - Immediate suburbs | 0.6 | 0.0 | 2.3 | 3.3 | 3.0 | 4.0 |
| - Outer suburbs | 0.5 | 0.4 | 0.3 | 2.5 | 2.3 | 1.8 |
| Provincial France | 0.2 | 1.4 | 0.3 | 2.4 | 2.3 | 2.5 |
| - Auvergne-Rhône-Alpes | 0.1 | 0.7 | ** | 2.0 | 1.4 | ** |
| - Hauts-de-France | 0.5 | 0.1 | ** | 1.8 | 1.1 | ** |
| * Conurbation of Lille | 2.5 | -1.3 | ** | 3.5 | 1.9 | ** |
| - Provence-Alpes-Côte d'Azur | -1.0 | 2.3 | ** | 1.4 | 2.5 | ** |
- ** index released on 1st of October 2018.
- Additional data (for example by department in Île-de-France) are available on the web page of the indicator.
- (p): provisional ; (sd): semi-definitive
- Scope: Metropolitan France
- Sources: INSEE, French notaries - Database Bien, Perval society
Pour en savoir plus
