


 29 August 2018
2018- n° 224Household consumption expenditure on goods was virtually stable in July (+0.1 %) Household consumption expenditure on goods - July 2018
29 August 2018
2018- n° 224Household consumption expenditure on goods was virtually stable in July (+0.1 %) Household consumption expenditure on goods - July 2018
In July 2018, household expenditure on goods slowed down: +0.1% in volume* after +0.3 % in june and +1.1 % in May. Consumption of food product increased a little (+0.2%) and the one of engineered goods was almost stable (+0.1%). Energy consumption decreased slightly (–0.2 %).
In July 2018, household expenditure on goods slowed down: +0.1% in volume* after +0.3 % in june and +1.1 % in May. Consumption of food product increased a little (+0.2%) and the one of engineered goods was almost stable (+0.1%). Energy consumption decreased slightly (–0.2 %).
graphiqueGraph1 – Total consumption of goods
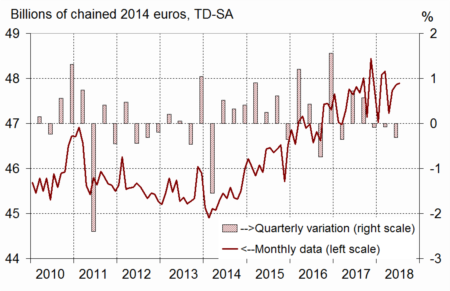
- Source: INSEE

*Volumes are measured at chain-link previous year prices (2014 euro billions) and all figures are trading-day and seasonally adjusted.
Food products: small rise
In July, food consumption increased slightly (+0.2%). In particular, purchases of agri-food products (dairy products, cereals, pasta, cans of food, etc.) increased a little, as well as the sales of drinks. However, the consumption of meat and meat products declined slightly. Tobacco consumption declined for the second consecutive month.
graphiqueGraph2 – Food products, engineered goods and energy
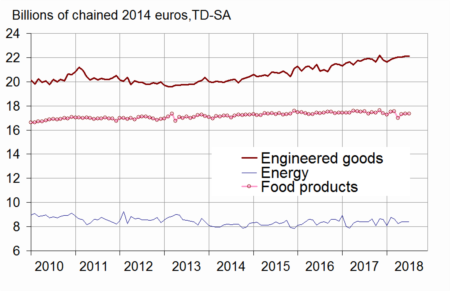
- Source: INSEE
Engineered goods: slowdown
In July, expenditure on engineered goods slowed down (+0.1% after +0.4% in June).
Durables: slight step back
Consumption of durables decreased in July (–0.3%), after two months of increase. Spending on household durables decreased clearly (–0.8% after +2.3%). In particular, purchases of television sets dropped sharply, after two consecutive months of increase related to the Football World Cup. Purchases of transport equipement were almost at the same level as in June (+0.1%), in spite of a reduction in second-hand car purchases.
graphiqueGraph3 – Breakdown of engineered goods
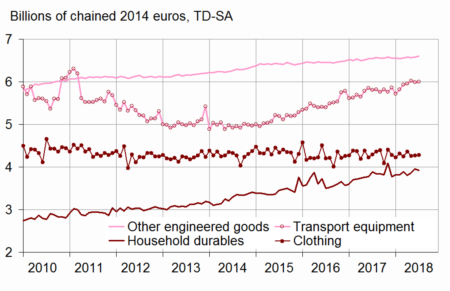
- Source: INSEE
Textile-clothing: slight acceleration
Expenses on textile-clothing accelerated slightly in July (+0.4% after +0.2%), mainly driven by clothes purchases. The consumption of shoes decreased for the third consecutive month.
Other engineered goods: increase
Purchases of “other engineered goods” were on the rise in July (+0.4%), particularly those of perfume and beauty products.
Energy: slight decrease
In July, energy consumption declined a little (–0.2%). While gas and electricity consumption increased slightly, fuel purchases decreased (–1.3%), mainly because of the fall in diesel consumption.
graphiqueGraph4 – Breakdown of energy

- Source: INSEE
The variation in June 2018 was revised upwards
Compared to the previous estimation, the change of household expenditure on goods in June 2018 was slightly revised upwards: +0.3% instead of +0.1%. Indeed, new information has been integrated and the seasonal adjustment coefficients have been updated.
tableauTable – Household consumption expenditure on goods
| Weight (1) | May 2018 | June 2018 | July 2018 | July 18 / July 17 | Q / Q-1 (2) | |
|---|---|---|---|---|---|---|
| Food products | 38 | 2..0 | 0.1 | 0.2 | –1.0 | 0.0 |
| - excl. Tobacco | 34 | 2.0 | 0.1 | 0.2 | –0.1 | 0.1 |
| Engineered goods | 45 | 0.0 | 0.4 | 0.1 | 1.3 | 0.7 |
| - Durables | 22 | 1.0 | 0.6 | –0.3 | 2.0 | 1.5 |
| Including : | 0.0 | 0.0 | 0.0 | 0.0 | 0.0 | |
| - Transport equipment | 12 | 1.1 | –0.5 | 0.1 | 3.3 | 1.7 |
| - Household durables | 7 | 1.5 | 2.3 | –0.8 | 0.9 | 1.9 |
| - Textile-clothing | 9 | –2.3 | 0.2 | 0.4 | –0.1 | –0.8 |
| - Other engineered goods | 14 | –0.1 | 0.1 | 0.4 | 1.0 | 0.4 |
| Energy | 18 | 1.9 | 0.4 | –0.2 | –0.2 | –1.7 |
| - Energy. water. waste | 10 | 3.4 | 0.6 | 0.6 | 0.5 | –2.8 |
| - Refined Products | 8 | 0.1 | 0.1 | –1.3 | –1.1 | –0.4 |
| Total | 100 | 1.1 | 0.3 | 0.1 | 0.2 | 0.0 |
| - Including Manufactured goods | 84 | 0.7 | 0.3 | 0.0 | 0.4 | 0.4 |
- (1) Weighting in the consumption expenditure on goods in value in 2017
- (2) Last three months / previous three months
Documentation
Methodology (pdf,23 Ko)
Pour en savoir plus
