


 14 August 2018
2018- n° 212In July 2018, consumer prices decreased by 0.1 over one month and rose by 2.3% year
on year Consumer price index - final results - July 2018
14 August 2018
2018- n° 212In July 2018, consumer prices decreased by 0.1 over one month and rose by 2.3% year
on year Consumer price index - final results - July 2018
In July 2018, the Consumer Prices Index (CPI) declined by 0.1%, after a stability in June. This slight drop came from a seasonal fall in manufactured product prices (−2.8%) due to summer sales, partly offset by a rebound in services prices (+1.1%), essentially in airfares with the beginning of school holidays. Energy prices slowed down (+0.5% after +0.9%). Finally, food prices recovered slightly (+0.1% after −0.2%).
Monthly change: -0.1% in July; Year-on-year change: +2.3%
In July 2018, the Consumer Prices Index (CPI) declined by 0.1%, after a stability in June. This slight drop came from a seasonal fall in manufactured product prices (−2.8%) due to summer sales, partly offset by a rebound in services prices (+1.1%), essentially in airfares with the beginning of school holidays. Energy prices slowed down (+0.5% after +0.9%). Finally, food prices recovered slightly (+0.1% after −0.2%).
Seasonally adjusted, consumer prices accelerated to +0.3% after a stability in June.
Year on year, consumer prices rose by 2.3%, that is 0.3 points of percentage more than in the previous month. This stronger inflation resulted essentially from a year-on-year acceleration in energy prices, and to a lesser extent, in service prices and tobacco prices. The lesser drop in manufactured product prices also contributed to the rise in inflation. Finally, the year-on-year inflation in food prices was unchanged.
Slight rise in core inflation year on year
Year on year, core inflation slighlty rose: +0.9% after +0.8% in the previous month. The Harmonised Index of Consumer Prices (HICP) dropped by 0.1% in July, after a stability in June; year on year, it grew by 2.6%, following 2.3% in the previous month.
Further acceleration in energy prices year on year
In July 2018, energy inflation increased for the fourth consecutive month (+14.3% year on year after +12.3% in June) owing to a strong acceleration in gas prices (+17.3% year-on-year after +6.4% last month) and to a further increase in the prices of petroleum products (+21.8% over a year after +21.0%).
tableauTable1 – Detailed figures for various groups
| Items | Weight | Index | Percentage change | |
|---|---|---|---|---|
| 2018 | July 2018 | m-on-m change(2) | y-on-y change(3) | |
| a) All households | ||||
| Overall | 10000 | 103.28 | −0.1 | 2.3 |
| Overall SA(1) | 10000 | 103.38 | 0.3 | 2.3 |
| Food | 1627 | 103.59 | 0.1 | 1.9 |
| Fresh food | 243 | 113.08 | −0.1 | 6.4 |
| Other food | 1384 | 102.06 | 0.2 | 1.2 |
| Tobacco | 193 | 119.74 | 0.4 | 16.8 |
| Manufactured products | 2594 | 96.88 | −2.8 | −0.1 |
| Clothing and footwear | 416 | 90.30 | −13.9 | 0.8 |
| Medical products | 425 | 92.76 | −0.1 | −2.2 |
| Other manufactured products | 1753 | 99.34 | −0.8 | 0.1 |
| Energy | 777 | 114.23 | 0.5 | 14.3 |
| Petroleum products | 408 | 120.92 | −0.9 | 21.8 |
| Services | 4809 | 104.36 | 1.1 | 1.3 |
| Actual rentals and services for dwellings | 764 | 100.79 | 0.0 | −0.3 |
| Health services | 617 | 102.62 | 0.1 | 0.4 |
| Transport | 282 | 109.37 | 8.7 | 1.4 |
| Communication | 223 | 98.27 | −0.1 | 0.7 |
| Other services | 2923 | 105.69 | 1.1 | 1.9 |
| Total except rents and tobacco | 9192 | 103.18 | −0.1 | 2.2 |
| Total except tobacco | 9807 | 102.96 | −0.1 | 2.0 |
| b) Urban working-class households or households of employees | ||||
| All products excluding tobacco | 9706 | 102.54 | −0.3 | 1.9 |
| c) Households that belong to the lowest equivalized disposable income quintile - France | ||||
| All products excluding tobacco | 9700 | 102.49 | −0.2 | 2.0 |
- (1) seasonally adjusted
- (2) [m/(m-1)]
- (3) [m/(m-12)]
- Geographical coverage: France excluding Mayotte
- Source: INSEE - Consumer Price Indices
Slight rise in services inflation
Year on year, services prices rose by 1.3% (+1.2% last month). Transport prices gathered pace (+1.4% year-on-year after +0.6%), particularly those of airfares (+1.0% year-on-year after +0.6%). The prices of rail transport also rose (+0.5% year-on-year after −0.2%) due to the end of promotional offers on discount cards. In this first month of school holidays, accommodation service prices accelerated to +5.7% over one year, after +5.2% in June. The year-on-year rise in communication services prices remained at 0.7%. By contrast, insurance prices slowed down (+1.2% after +1.6% over a year), as to a lesser extent those of health services (+0.4% after +0.5% year on year). Moreover, the prices of actual rentals and of services for dwellings decreased again (−0.3% after −0.2%).
Slighter decline in manufactured products prices year on year
Year on year, manufactured products prices dropped by 0.1%, after a 0.2% decrease in the previous month. Indeed, clothing and footwear prices bounced back to +0.8% over a year (−0.3% in June), due to a lesser impact of summer sales than last year. However; the prices of “other manufactured products” slightly slowed down (+0.1% year on year after +0.2%): the further rise in new motor cars prices (+2.3% year on year after +1.8%) was offset by the sharp downturn in the prices of furniture and furnishing (−0.7% year-on-year after +0.8%) and equipement for sport (−1.9% over a year after −0.5%). Furthermore, health product prices decreased by 2.2% year on year as in June.
Inflation in food prices was unchanged
In July 2018, food prices rose by 1.9% over a year, as in the previous month. The prices of fresh products accelerated once again (+6.4% year-on-year after +5.9%), because of a sharper rise in fresh vegetables prices (+10.1% y-o-y after +8.3%) and in fresh seafood prices (+3.1% after +1.1% year on year). Nevertheless, fresh fruits prices slowed down in July (+8.0% year-on-year after +9.1%). Excluding fresh products, food prices rose by 1.2% over a year, the same year-on-year increase as in the six last months.
graphiqueGraph1 – Consumer Price Index (CPI), core inflation (ISJ) (1) and Harmonised Index of Consumer Prices (HICP) (2) year-on-year changes
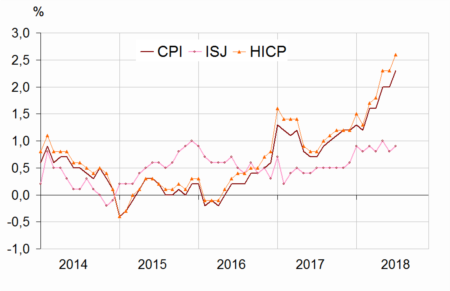
tableauTable2 – Detailed figures for Core inflation(1) and HICP(2)
| Items | Weight | Index | Percentage change | |
|---|---|---|---|---|
| 2018 | July 2018 | m-on-m change(3) | y-on-y change(4) | |
| Core inflation - All items | 6041 | 102.00 | 0.1 | 0.9 |
| Food excluding fresh products, meat, milk and exotic products | 740 | 101.25 | −0.1 | 0.6 |
| Manufactured products | 2125 | 100.14 | 0.1 | 0.3 |
| Services including actual rentals and services for dwellings | 3176 | 103.49 | 0.2 | 1.4 |
| HICP - All items | 103.80 | −0.1 | 2.6 | |
- (1) Core inflation indicator excludes public sector prices, the most volatile consumer prices and the tax measures. Seasonally adjusted, this index is calculated for all households in France excluding overseas departments and territories. (in French “indice d'inflation sous-jacent - ISJ”)
- (2) HICP: Harmonised Indices of Consumer Prices are inflation figures designed for international comparison between Member states of the European Union. This index is calculated for all households in France excluding Mayotte.
- (3) [m/(m-1)]
- (4) [m/(m-12)]
- Source: INSEE - Consumer Price Indices
Revisions
Compared with the provisional estimates published on July 31, 2018, the month-on-month and year-on-year changes in the CPI and in the HICP are unchanged.
Documentation
Methodology (pdf,141 Ko)
Pour en savoir plus
