


 27 July 2018
2018- n° 200Household consumption expenditure on goods was virtually stable in June (+0.1%) and
decreased over the second quarter (−0.3%) Household consumption expenditure on goods - June 2018
27 July 2018
2018- n° 200Household consumption expenditure on goods was virtually stable in June (+0.1%) and
decreased over the second quarter (−0.3%) Household consumption expenditure on goods - June 2018
In June 2018, household expenditure on goods was almost unchanged: +0.1% in volume*. Apart from household durables purchases, which were relatively dynamic, consumption was sluggish. Over the quarter, household consumption on goods decreased for the the third consecutive quarter (−0.3% after −0.1% in first quarter 2018 as well as in fourth quarter 2017).
In June 2018, household expenditure on goods was almost unchanged: +0.1% in volume*. Apart from household durables purchases, which were relatively dynamic, consumption was sluggish. Over the quarter, household consumption on goods decreased for the the third consecutive quarter (−0.3% after −0.1% in first quarter 2018 as well as in fourth quarter 2017).
graphiqueGraph1 – Total consumption of goods
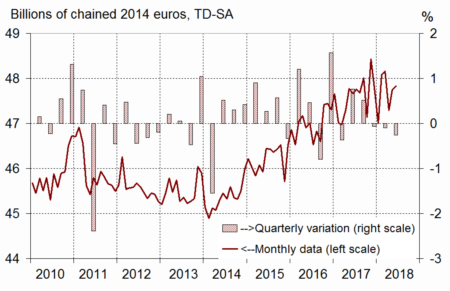
- Source: INSEE

*Volumes are measured at chain-link previous year prices (2014 euro billions) and all figures are trading-day and seasonally adjusted.
Food products: stability
In June, food consumption was stable. Over the second quarter, it decreased by −1.3%, with a strong decline in tobacco spending and, to a lesser extent, in meat and meat product purchases.
graphiqueGraph2 – Food products, engineered goods and energy
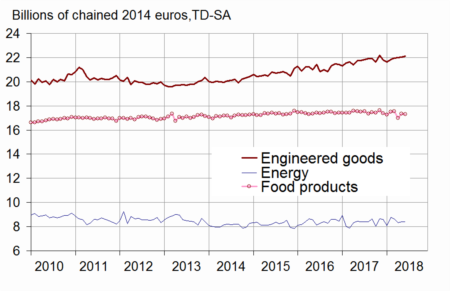
- Source: INSEE
Energy: consumption was stable
In June, energy consumption was stable, the slight downturn in gas and electricity consumption being offset by the increase in fuel consumption. Over the whole quarter, energy consumption decreased by −1.7%. Expenses on gas and electricity declined strongly (−3.4%), due to temperatures much higher than the seasonal norm, especially in April. Fuel purchases increased moderately (+0.5%).
graphiqueGraph3 – Breakdown of energy
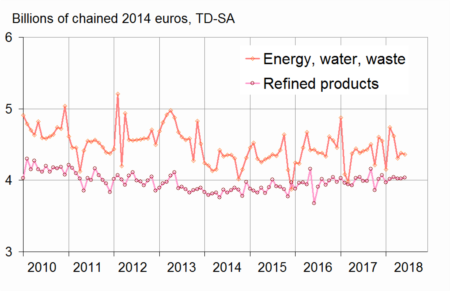
- Source: INSEE
Engineered goods: rising slightly
In June, expenditure on manufactured goods increased slightly (+0.4%), mainly due to household durables purchases' dynamism. Over the quarter, they rose by +1.2%, thanks in particular to vehicle purchases, which accelerated clearly (+3.0% after +0.2%).
Durables: slowdown
Consumption of durables slowed down in June (+0.6% after +1.1%). Expenses on transport equipment fell (−0.4% after +1.1%), but household durables consumption clearly accelerated (+2.3% after +1.6%). Indeed, television purchases remained high for the second consecutive month and telephone ones intensified strongly in June. Over the quarter, purchases of durables bounced back (+1.8% after −0.4%).
Textile-clothing: slight increase
Expenditure on textile-clothing bounced back slightly in June (+0.3% after −2.0%), despite a decrease in shoes consumption. Over the quarter, expenditure on textile-clothing increased (+0.7%), driven by shoes purchases as well as by the expenses on clothes.
Other engineered goods: virtually stable
Purchases of “other engineered goods” were virtually stable in June (+0.1% after a stability in May). However, purchases of perfume and beauty products were quite dynamic, contrary to hardware expenses. Over the quarter, expenses on “other engineered goods” bounced back (+0.4% after −0.2%).
graphiqueGraph4 – Breakdown of engineered goods
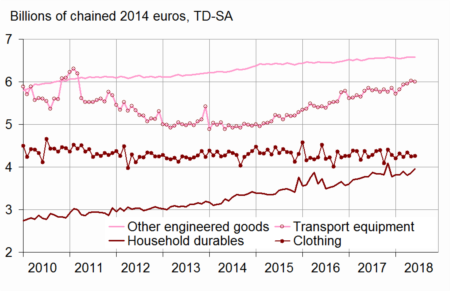
- Source: INSEE
The variation in May 2018 was revised upwards
Compared to the previous estimation, the change of household expenditure on goods in May 2018 was slightly revised upwards: +1.0% instead of +0.9%. Indeed, new information has been integrated and the seasonal adjustment coefficients have been updated.
tableauTable – Household consumption expenditure on goods
| Weight (1) | April 2018 | May 2018 | June 2018 | June 18/ June 17 | Q2 / Q1 | |
|---|---|---|---|---|---|---|
| Food products | 38 | –3.2 | 2.0 | 0.0 | –1.0 | –1.3 |
| - excl. Tobacco | 34 | –3.6 | 2.0 | 0.1 | 0.0 | –0.9 |
| Engineered goods | 45 | 0.2 | 0.1 | 0.4 | 1.7 | 1.2 |
| - Durables | 22 | –0.6 | 1.1 | 0.6 | 2.9 | 1.8 |
| Including : | 0.0 | 0.0 | 0.0 | 0.0 | 0.0 | |
| - Transport equipment | 12 | 0.5 | 1.1 | –0.4 | 2.4 | 3.0 |
| - Household durables | 7 | –2.3 | 1.6 | 2.3 | 4.6 | 0.8 |
| - Textile-clothing | 9 | 2.3 | –2.0 | 0.3 | 0.6 | 0.7 |
| - Other engineered goods | 14 | 0.3 | 0.0 | 0.1 | 0.6 | 0.4 |
| Energy | 18 | –4.0 | 0.9 | 0.0 | –0.3 | –1.7 |
| - Energy, water, waste | 10 | –6.7 | 1.6 | –0.4 | –0.6 | –3.4 |
| - Refined Products | 8 | –0.5 | 0.1 | 0.4 | –0.1 | 0.5 |
| Total | 100 | –1.8 | 1.0 | 0.1 | 0.3 | –0.3 |
| - Including Manufactured goods | 84 | –1.1 | 0.8 | 0.3 | 0.7 | 0.2 |
- (1) Weighting in the consumption expenditure on goods in value in 2017
Documentation
Methodology (pdf,23 Ko)
Pour en savoir plus
