


 29 June 2018
2018- n° 171Household consumption expenditure on goods bounced back in May 2018 (+0.9%) Household consumption expenditure on goods - May 2018
29 June 2018
2018- n° 171Household consumption expenditure on goods bounced back in May 2018 (+0.9%) Household consumption expenditure on goods - May 2018
In May 2018, household expenditure on goods bounced back, although without erasing last month's drop: +0.9% in volume*, after −1.8% in April. Food products' purchases and energy consumption increased, as well as car and TV purchases. However, clothes and shoes' purchases declined strongly.
In May 2018, household expenditure on goods bounced back, although without erasing last month's drop: +0.9% in volume*, after −1.8% in April. Food products' purchases and energy consumption increased, as well as car and TV purchases. However, clothes and shoes' purchases declined strongly.
graphiqueGraph1 – Total consumption of goods

- Source: INSEE

*Volumes are measured at chain-link previous year prices (2014 euro billions) and all figures are trading-day and seasonally adjusted.
Food products: bouncing back
In May, food consumption bounced back (+1.8%), after a strong drop in April (−2.9%). This growth was global and affected fruits and vegetables as well as meat, meat products, dairy products and drinks.
Tobacco consumption also increased for the second consecutive month, after the strong declined recorded in March.
graphiqueGraph2 – Food products, engineered goods and energy
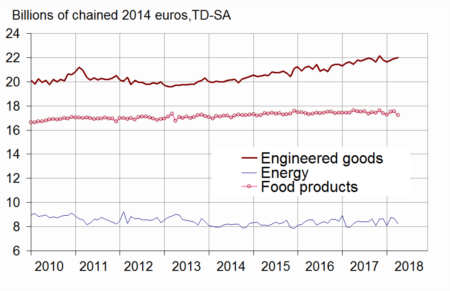
- Source: INSEE
Energy: moderate growth
In May, energy consumption increased moderately (+1.7% after −5.0%). Heating expenses increased again, after temperatures in April clearly above seasonal norms. Consumption of refined products increased a bit (+0.4%): gasoline consumption was on the rise, but diesel consumption was stable and the one of liquefied petroleum gas decreased.
graphiqueGraph3 – Breakdown of energy
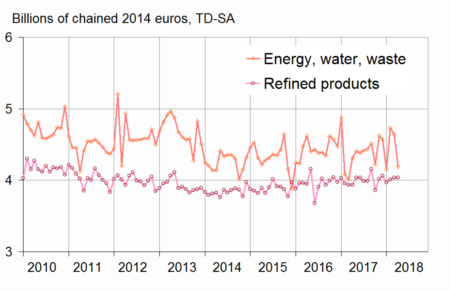
- Source: INSEE
Engineered goods: virtually stable
In May, expenditure on manufactured goods was virtually stable (−0.1%). The upturn in durables purchases was offset by the downturn in textile-clothing purchases.
Durables: upturn
Consumption of durables bounced back in May (+0.9% after −0.7%). Expenses on transport equipment increased, driven by second-hand car purchases, and to a lesser extent by motorcycles purchases. Spending on housing equipment was on the rise (+1.2%), mainly due to purchases of television sets (as it is often the case during the months preceding major sporting events).
Textile-clothing: marked downturn
After a sharp upturn in April, expenditure on textile-clothing clearly deteriorated in May (−3.0% after +3.4%). While textile's purchases were relatively stable, clothes and shoes's consumption decreased strongly.
Other engineered goods: virtually stable
Purchases of “other engineered goods” were virtually stable in May. In particular, consumption of hardware items increased slightly, while purchases of perfume and beauty products fell.
graphiqueGraph4 – Breakdown of engineered goods
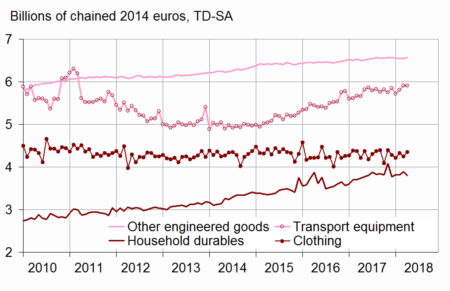
- Source: INSEE
The variation in April 2018 is revised downwards
Compared to the previous estimation, the change of household expenditure on goods in April 2018 was revised downwards: −1.8% instead of −1.5%. Indeed, new information has been integrated and the seasonal adjustment coefficients have been updated.
tableauTable – Household consumption expenditure on goods
| Weight (1) | Mar. 2018 | April 2018 | May 2018 | May 18 / May 17 | Q / Q-1 | |
|---|---|---|---|---|---|---|
| Food products | 38 | 0.3 | –2.9 | 1.8 | –1.2 | –0.5 |
| - excl. Tobacco | 34 | 1.5 | –3.4 | 1.7 | –0.4 | 0.4 |
| Engineered goods | 45 | 0.6 | 0.4 | –0.1 | 1.0 | 1.1 |
| - Durables | 22 | 1.8 | –0.7 | 0.9 | 2.6 | 1.8 |
| Including : | 0.0 | 0.0 | 0.0 | 0.0 | 0.0 | |
| - Transport equipment | 12 | 1.8 | 0.1 | 1.0 | 3.4 | 2.5 |
| - Household durables | 7 | 1.8 | –2.0 | 1.2 | 2.3 | 1.2 |
| - Textile-clothing | 9 | –1.7 | 3.4 | –3.0 | –2.7 | 0.6 |
| - Other engineered goods | 14 | 0.2 | 0.2 | 0.1 | 0.9 | 0.1 |
| Energy | 18 | –1.0 | –5.0 | 1.7 | –1.1 | –0.8 |
| - Energy, water, waste | 10 | –2.4 | –8.6 | 2.8 | –2.4 | –1.9 |
| - Refined Products | 8 | 0.7 | –0.4 | 0.4 | 0.5 | 0.5 |
| Total | 100 | 0.2 | –1.8 | 0.9 | –0.2 | 0.2 |
| - Including Manufactured goods | 84 | 0.4 | –0.9 | 0.6 | 0.3 | 0.4 |
- (1) Weighting in the consumption expenditure on goods in value in 2017
- (2) Last three months / previous three months
Documentation
Methodology (pdf,23 Ko)
Pour en savoir plus
