


 22 June 2018
2018- n° 162Households' purchasing power fell back (−0.6% after +0.1%) Quarterly national accounts - detailed figures - first quarter 2018
22 June 2018
2018- n° 162Households' purchasing power fell back (−0.6% after +0.1%) Quarterly national accounts - detailed figures - first quarter 2018
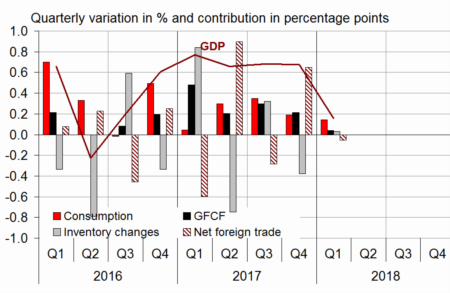
In Q1 2018, GDP in volume terms* decelerated: +0.2% after +0.7% in Q4 2017. Households consumption expenditures rose at almost the same pace as in Q4 2017 (+0.1% after +0.2%), while total gross fixed capital formation was less dynamic (GFCF: +0.2% after +0.9%). Overall, final domestic demand excluding inventory changes slowed down and contributed less to GDP growth: +0.2 points after +0.4 points
Exports fell back slightly (−0.3% after +2.4%) and imports were almost stable (−0.1% after +0.3%). All in all, foreign trade balance's contribution to GDP growth is slightly negative: −0.1 points after +0.6 points. Meanwhile, changes in inventory were stable and therefore did not contribute to GDP growth.

* This growth rate is seasonally and working-day adjusted; volumes are chain-linked previous-year-prices volumes.
graphiqueGraph – GDP and its main components
- Source: INSEE
tableauTab1 – GDP and its main components: chain-linked volumes
| 2017 Q2 | 2017 Q3 | 2017 Q4 | 2018 Q1 | 2017 | 2018 (ovhg) | |
|---|---|---|---|---|---|---|
| GDP | 0.7 | 0.7 | 0.7 | 0.2 | 2.3 | 1.2 |
| Imports | -0.3 | 1.9 | 0.3 | -0.1 | 4.1 | 1.0 |
| Household consumption *expenditure | 0.4 | 0.4 | 0.2 | 0.1 | 1.1 | 0.6 |
| General government's *consumption expenditure | 0.4 | 0.5 | 0.3 | 0.3 | 1.4 | 0.9 |
| GFCF | 0.9 | 1.3 | 0.9 | 0.2 | 4.7 | 1.8 |
| *of which Non-financial corporated and unincorporated enterprises | 0.6 | 1.6 | 1.2 | 0.1 | 4.4 | 2.0 |
| Households | 1.5 | 1.0 | 0.6 | 0.2 | 5.6 | 1.5 |
| General government | 0.4 | 0.3 | 0.4 | 0.4 | 1.6 | 1.0 |
| Exports | 2.6 | 1.1 | 2.4 | -0.3 | 4.7 | 2.7 |
| Contributions: | ||||||
| Internal demand excluding inventory changes | 0.5 | 0.6 | 0.4 | 0.2 | 2.0 | 0.9 |
| Inventory changes | -0.7 | 0.3 | -0.4 | 0.0 | 0.2 | -0.3 |
| Net foreign trade | 0.9 | -0.3 | 0.6 | -0.1 | 0.1 | 0.5 |
- Source: INSEE
tableauTab2 – Production, consumption and GFCF: main components
| 2017 Q2 | 2017 Q3 | 2017 Q3 | 2018 Q1 | 2017 | 2018 (ovhg) | |
|---|---|---|---|---|---|---|
| Production of branches | 0.7 | 0.8 | 0.9 | 0.1 | 2.6 | 1.4 |
| Goods | 0.7 | 1.0 | 1.1 | -0.6 | 2.2 | 0.9 |
| Manufactured Industry | 0.6 | 1.0 | 1.3 | -1.0 | 2.4 | 0.6 |
| Construction | 1.1 | 0.6 | 0.5 | -0.2 | 3.5 | 0.7 |
| Market services | 0.8 | 0.9 | 1.0 | 0.5 | 3.2 | 1.9 |
| Non-market services | 0.4 | 0.5 | 0.4 | 0.2 | 1.1 | 0.8 |
| Household consumption | 0.4 | 0.4 | 0.2 | 0.1 | 1.1 | 0.6 |
| Food products | 0.8 | -0.6 | 0.1 | -0.3 | 0.3 | -0.3 |
| Energy | 1.1 | 1.4 | -0.4 | 0.6 | 0.1 | 1.3 |
| Engineered goods | 0.7 | 1.1 | -0.1 | -0.3 | 2.6 | 0.4 |
| Services | 0.3 | 0.6 | 0.5 | 0.4 | 1.6 | 1.1 |
| GFCF | 0.9 | 1.3 | 0.9 | 0.2 | 4.7 | 1.8 |
| Manufactured goods | 0.3 | 1.8 | 1.7 | -1.2 | 3.7 | 1.0 |
| Construction | 1.2 | 0.7 | 0.3 | 0.2 | 3.5 | 1.1 |
| Market services | 1.0 | 1.7 | 1.3 | 1.1 | 7.0 | 3.2 |
- Source: INSEE
Purchasing power declined in Q1 2018
Households' gross disposable income (GDI) was stable in current euros in Q1 2018 (0.0% after +0.6%). The rise of taxes on income and wealth (+9.4% after +1.2%), mostly due to the increase of the generalised social contribution (CSG), is overall only partly compensated by the decrease of households' social contribution (−7.4% after +0.6%). Conversely, wages received by households accelerated slightly (+0.9% after +0.8%), notably because of the indemnity compensating the CSG increase in the public sector.
Households' social benefits grew at almost the same pace (+0.5% after +0.6%).
Households' consumption prices remained dynamic in Q1 (+0.6% after +0.5%), notably owing to the increase of energy prices sustained by the fiscal mesures on energy transition, such that households' purchasing power decreased markedly in Q1 (−0.6% after +0.1%). When measured per consumption unit, it also withdrew (−0.7%, after 0.0%). In Q1 2018, households' consumption was nearly stable while their purchasing power dropped. Thus, their saving rate fell back : it stands at 13.6% after 14.2% in Q4 2017.
tableauTab3 – Sectoral accounts
| 2017 Q2 | 2017 Q3 | 2017 Q3 | 2018 Q1 | 2017 | 2018 (ovhg) | |
|---|---|---|---|---|---|---|
| Profit ratio of NFCs* (level) | 31.9 | 32.1 | 32.0 | 31.9 | 32.0 | |
| Households' purchasing power | 0.6 | 0.4 | 0.1 | -0.6 | 1.4 | -0.1 |
- *NFCs: non-financial corporations
- Source: INSEE
tableauTab4 – Households' disposable income and ratios of households' account
| 2017 Q2 | 2017 Q3 | 2017 Q4 | 2018 Q1 | 2017 | 2018 (ovhg) | |
|---|---|---|---|---|---|---|
| HDI | 0.7 | 0.6 | 0.6 | 0.0 | 2.7 | 1.0 |
| Household purchasing power | 0.6 | 0.4 | 0.1 | -0.6 | 1.4 | -0.1 |
| HDI by cu* (purchasing power) | 0.5 | 0.4 | 0.0 | -0.7 | 0.9 | -0.4 |
| Adjusted HDI (purchasing power) | 0.6 | 0.5 | 0.2 | -0.4 | 1.5 | 0.2 |
| Saving rate (level) | 14.3 | 14.3 | 14.2 | 13.6 | 14.2 | |
| Financial saving rate (level) | 4.3 | 4.4 | 4.5 | 3.6 | 4.4 |
- *cu: consumption unit
- Source: INSEE
Non-financial corporations' profit ratio was virtually stable at 31.9% in early 2018
In Q1 2018, non-financial corporations' profit ratio remained almost stable at 31.9% (after 32.0%). The decline of productivity contributed negatively to the profit ratio's evolution, as did the terms of trade owing to the rise in energy prices. Conversely, real wages' mild decline, and the subventions paid notably as part of the CICE supported the profit ratio.
tableauTab5 – Ratios of non-financial corporations' account
| 2017 Q2 | 2017 Q3 | 2017 Q4 | 2018 Q1 | 2017 | |
|---|---|---|---|---|---|
| Profit share | 31.9 | 32.1 | 32.0 | 31.9 | 32.0 |
| Investment ratio | 23.4 | 23.5 | 23.6 | 23.6 | 23.5 |
| Savings ratio | 22.5 | 23.0 | 22.4 | 22.9 | 22.5 |
| Self-financing ratio | 96.0 | 97.8 | 94.9 | 97.0 | 95.9 |
- Source: INSEE
General government deficit increased slightly in Q1 2018
In Q1 2018, general government net borrowing increased a little, to 2.5% of the GDP after 2.3% in Q4 2017, because the spendings outgrew the revenues.
Spending grew at a slower pace in Q1 (+0.5% after +0.9%). Indeed, the amounts paid to businesses to refund the 3% tax on dividends were lower than in Q4 2017.
Meanwhile, revenue slowed down significantly (+0.3% after +1.6%). The rise of CSG revenues and energy taxes are compensated by the decrease of contributions and the backlash of the surtax on businesses.
tableauTab6 – Expenditure. receipts and net borrowing of public administrations)
| 2017 Q2 | 2017 Q3 | 2017 Q4 | 2018 Q1 | 2017 | |
|---|---|---|---|---|---|
| In billions of euros | |||||
| Total expenditure | 321.1 | 324.6 | 327.6 | 329.4 | 1292.5 |
| Total receipts | 307.2 | 309.0 | 314.1 | 314.9 | 1232.8 |
| Net lending (+) or borrowing (–) | -13.9 | -15.6 | -13.4 | -14.4 | -59.7 |
| In % of GDP | |||||
| Net lending (+) or borrowing (–) | -2.4 | -2.7 | -2.3 | -2.5 | -2.6 |
- Source: INSEE
Revisions
The estimation of GDP growth and its components in Q1 2018 is confirmed. Some slight revisions in the various agregates balance each other, they mostly owe to the indicators revising and to the update of the working-day adjustment.
Pour en savoir plus
