


 21 June 2018
2018- n° 159In June 2018, the business climate is stable in services Monthly survey of services - June 2018
21 June 2018
2018- n° 159In June 2018, the business climate is stable in services Monthly survey of services - June 2018
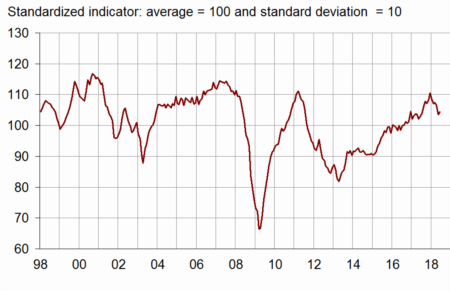
According to business managers surveyed in June 2018, the business climate in services is stable. At 104, the business climate composite indicator stands above its long-term average (100).
Because of late businesses' answers that have been taken into account, the composite indicator for May has been revised upward by one point.
- The balances of opinion on activity have bounced back
- In road transport, the business climate has started to improve again
- In accommodation and food services, the business climate has picked up a little
- The business climate has slightly improved in information and communication
- The business climate remains deteriorated in real estate activities
- In professional activities, the business climate has brightened again
- The business climate has weakened a little again in administrative and support service activities
According to business managers surveyed in June 2018, the business climate in services is stable. At 104, the business climate composite indicator stands above its long-term average (100).
Because of late businesses' answers that have been taken into account, the composite indicator for May has been revised upward by one point.
graphiqueGraph 1 – Business climate composite indicator
In June 2018, the turning point indicator has returned into the area indicating a favourable short-term economic situation.
graphiqueGraph 2 – Turning point indicator
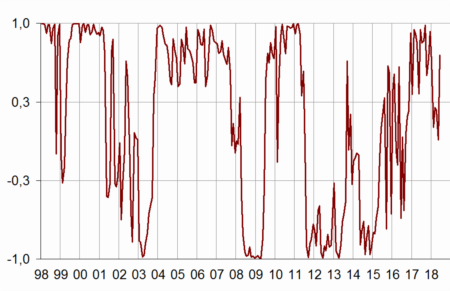
- Note: close to 1 (respectively –1), this indicator indicates a favourable short-term economic situation (respectively unfavourable). The uncertainty area is between –0.3 and +0.3.
The balances of opinion on activity have bounced back
The balances on past and expected activity have recovered. The balance of opinion on expected demand has picked up too. However, the optimism of business managers on the general outlook over their sector has weakened. All of these balances stand above their long-term average.
The balance on past employment has clearly grown in June whereas it had decreased and reached its average since April. That on expected employment has sharply dipped but remains however above its average.
The balances of opinion on past and expected investments have weakened but remain above their long-term average.
tableauTable 1 – Economic outlook in the services sector
| Average* | March 18 | April 18 | May 18 | June 18 | |
|---|---|---|---|---|---|
| Composite indicator | 100 | 107 | 107 | 104 | 104 |
| General outlook | –7 | 3 | 3 | 0 | –2 |
| Past activity | 2 | 6 | 8 | 1 | 6 |
| Expected activity | 2 | 4 | 5 | 1 | 4 |
| Expected demand | 0 | 8 | 4 | 2 | 4 |
| Past selling prices | –4 | –2 | 0 | –2 | –1 |
| Expected selling prices | –3 | –3 | –3 | –3 | –4 |
| Past employment | 3 | 8 | 3 | 3 | 9 |
| except temporary work agencies | 1 | 3 | 1 | 0 | 5 |
| Expected employment | 3 | 15 | 12 | 12 | 7 |
| except temporary work agencies | 0 | 6 | 5 | 6 | 4 |
| Investments | |||||
| Past investments | 2 | 4 | 7 | 7 | 3 |
| Expected investments | 1 | 5 | 4 | 8 | 6 |
- * Average since 1989 for the composite indicator and since 1988 for the balances of opinion
- Source: INSEE, monthly business survey in services.
The business climate composite indicator has improved in virtually all sub-sectors, except in administrative and support service activities. It remains well above its long-term average in road tranport, accommodation and food service activities, professional, scientific and technical activities and in administrative and support service activities.
In road transport, the business climate has started to improve again
In road transport, the business climate indicator has gained two points. At 112, it is clearly above its average level. The balances on activity have climbed. That on expected demand has strongly grown. The other balances have fallen back. All balances are above their average.
In accommodation and food services, the business climate has picked up a little
After a sharp decline in the previous month, the climate in accommodation and food services has gained one point. At 109, it remains well above its average. The balances on activity have recovered. Regarding employment, the balance on past employment has clearly increased but that on expected employment has strongly fallen back.
The business climate has slightly improved in information and communication
In information and communication, the business climate has gained one point (101). The balances on activity and on expected demand have picked up but remain below their average level. The balances on employment and on general outlook have slightly decreased.
The business climate remains deteriorated in real estate activities
In real estate activities, the climate has gained one point (89) but stands significantly below its average level. The balances on expected activity and on general outlook have declined and so, remain deteriorated. However, the balances of opinion on past activity and expected demand have improved again.
In professional activities, the business climate has brightened again
The business climate in professional, scientific and technical activities has gained three points (108) and stands well above its long-term average. All the balances of opinion remain above their average and only the balance on expected employment has slightly slipped back.
The business climate has weakened a little again in administrative and support service activities
In administrative and support service activities, the climate has faltered for the third month in a row. At 107, it remains nevertheless well above its average. The balances on expected activity, on expected demand, on general outlook and on expected employment have declined. However, all balances stand above their average.
tableauTable 2 – Business climate composite indicator and balances of opinion by sub-sector in services
| Aggregated classification (NA 2008) at level A21 | Mean* | March 18 | April 18 | May 18 | June 18 |
|---|---|---|---|---|---|
| Road transport (8%) | |||||
| Composite indicator | 100 | 114 | 110 | 110 | 112 |
| Past activity | –6 | 16 | 14 | 5 | 6 |
| Expected activity | –7 | 11 | 6 | 6 | 9 |
| Expected demand | –10 | 13 | 8 | 9 | 16 |
| Past employment | –5 | 18 | –1 | 7 | 3 |
| Expected employment | –8 | 8 | 2 | 5 | –1 |
| General outlook | –20 | 12 | 6 | 7 | 1 |
| Accommodation and food service activities (11%) | |||||
| Composite indicator | 100 | 109 | 112 | 108 | 109 |
| Past activity | –7 | –9 | 9 | –3 | 3 |
| Expected activity | –7 | 2 | 3 | –1 | 4 |
| Expected demand | –9 | 4 | 2 | –1 | 0 |
| Past employment | –4 | –7 | –4 | –4 | 3 |
| Expected employment | –5 | –3 | –3 | 3 | –6 |
| General outlook | –13 | –4 | –1 | –6 | –6 |
| Information and communication (24%) | |||||
| Composite indicator | 100 | 102 | 102 | 100 | 101 |
| Past activity | 8 | 3 | 5 | –10 | 3 |
| Expected activity | 9 | 1 | 5 | 1 | 7 |
| Expected demand | 10 | 10 | 4 | –1 | 2 |
| Past employment | 6 | 16 | 18 | 12 | 10 |
| Expected employment | 11 | 13 | 13 | 13 | 12 |
| General outlook | 0 | 3 | 3 | 4 | 2 |
| Real estate activities (13%) | |||||
| Composite indicator | 100 | 89 | 85 | 88 | 89 |
| Past activity | 7 | 2 | –1 | 5 | 8 |
| Expected activity | 7 | –2 | –7 | –6 | –8 |
| Expected demand | 2 | 5 | 0 | 3 | 6 |
| Past employment | 3 | –6 | –3 | 2 | 2 |
| Expected employment | 3 | 3 | 11 | 6 | 7 |
| General outlook | –3 | –15 | –17 | –16 | –18 |
| Professional, scientific and technical activities (24%) | |||||
| Composite indicator | 100 | 110 | 109 | 105 | 108 |
| Past activity | –1 | 6 | 7 | 7 | 8 |
| Expected activity | –2 | 6 | 2 | 0 | 5 |
| Expected demand | –5 | 4 | 3 | –1 | –1 |
| Past employment | 1 | 6 | 10 | 4 | 12 |
| Expected employment | 0 | 10 | 11 | 12 | 10 |
| General outlook | –9 | 3 | 4 | –3 | 0 |
| Administrative and support service activities (18%) | |||||
| Composite indicator | 100 | 112 | 110 | 108 | 107 |
| Past activity | 6 | 24 | 14 | 11 | 16 |
| Expected activity | 5 | 15 | 17 | 10 | 9 |
| Expected demand | 3 | 15 | 13 | 11 | 9 |
| Past employment | 10 | 13 | 0 | 6 | 12 |
| Expected employment | 8 | 33 | 23 | 22 | 13 |
| General outlook | –4 | 11 | 10 | 9 | 6 |
- The figures in parentheses indicate the weights used to aggregate the sub-sector balances of opinion.
- *Composite indicator: average since 1989 (2006 for road transport); balances of opinion: average since 1988 (2006 for road transport)
- Source: INSEE, monthly business survey in services.
Documentation
Abbreviated Methodology (2017) (pdf,177 Ko)
Pour en savoir plus
Time series : Economic outlook surveys – Services
