


 19 June 2018
2018- n° 156In May, the prices of all imported raw materials accelerated Prices of oil and raw material imports - May 2018
19 June 2018
2018- n° 156In May, the prices of all imported raw materials accelerated Prices of oil and raw material imports - May 2018
In May 2018, the price of crude oil in euros ramped up again (+10.9% after +9.8% in April). The prices in euros of all other imported commodities accelerated too (+5.5% after +0.3%): both as a result of raw food materials prices (+5.7% after +0.1%) and because of industrial raw materials prices (+5.4% after +0.6%).
In May 2018, the price of crude oil in euros ramped up again (+10.9% after +9.8% in April). The prices in euros of all other imported commodities accelerated too (+5.5% after +0.3%): both as a result of raw food materials prices (+5.7% after +0.1%) and because of industrial raw materials prices (+5.4% after +0.6%).
Oil price ramped up
In May 2018, the price of North Sea crude oil (Brent) in euros ramped up again (+10.9% after +9.8%) to an average of €65 per barrel. The decrease was less marked in dollars (+6.8% after +9.0%), because the euro depreciated in May
tableauTable1 – Oil and petroleum products
| Prices | Change (%) | |||
|---|---|---|---|---|
| of last month | over the last month | over the last 3 months | over the last 12 months | |
| Brent in $ per barrel | 76,9 | 6,8 | 17,7 | 49,5 |
| Brent in € per barrel | 65,2 | 10,9 | 23,2 | 40,2 |
| Gasoline cts €/L | 47,7 | 10,8 | 22,6 | 29,7 |
| Gas Oil | 574,4 | 10,8 | 22,5 | 39,6 |
| Heavy fuel | 337,8 | 3,9 | 5,2 | 19,4 |
| Naphtha | 559,0 | 14,7 | 24,8 | 42,7 |
- Prices are in euros per tonne unless otherwise specified
- Source : INSEE
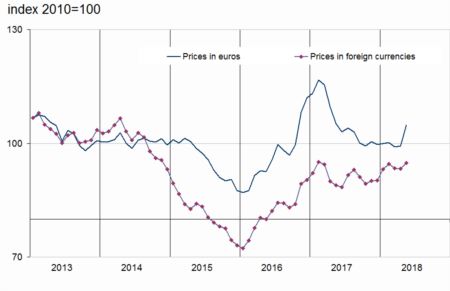
The prices of food commodity accelerated frankly…
In euros, the prices of raw food materials ramped up frankly (+5.7% after +0.1%). The prices of cereals accelerated clearly (+6.1% after +3.5%) as those of tropical foodstuffs (+4.4% after +2.3%), and seafood products (+7.7% after +1.2%). The prices of oil seeds and vegetable oils recovered (+2.2% after −0.4%), and those of meats bounced back (+8.1% after −3.5%) as sugar price (+4.3% after −7.6% in April).
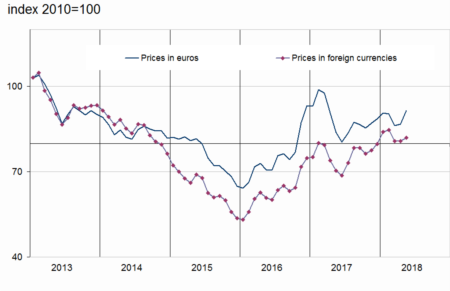
…as well as industrial commodity prices.
In May 2018, the prices in euros of industrial raw materials gathered pace clearly (+5.4% after +0.6%). Those of agro-industrial raw materials increased considerably (+9.2% after +2.2%), again because of sawn softwood price (+18.1% after +5.6%) and wood pulp price (+7.4% after +3.0%). The prices of natural fibres speeded up clearly (+8.0% after +0.4%), while natural rubber price recovered (+8.0% after −3.8%). The price of tropical wood fell back (−0.5% after +1.2%), and the price of hide decreased less than in April (−0.2% after −2.8%). The prices of minerals accelerated (+4.5% after +0.2%), largely due to non-ferrous metals (+4.6% after +4.5%) and ferrous metals (+4.8% after −5.9%). The prices of precious metals speeded up too (+2.1% after +1.0%).
tableauTable2 – Imported raw materials (excluding energy) in euros
| Index | Changes (%) | |||
|---|---|---|---|---|
| of last month | over the last month | over the last 3 months | over the last 12 months | |
| Food total | 121,5 | 5,7 | 8,5 | –8,3 |
| Tropical foodstuffs | 102,7 | 4,4 | 12,7 | –2,7 |
| Oil seeds, vegetable oils | 111,4 | 2,2 | 1,3 | –5,0 |
| Cereals | 103,9 | 6,1 | 12,8 | 3,3 |
| Sugar | 59,8 | 4,3 | –8,6 | –29,4 |
| Meat | 145,9 | 8,1 | 5,1 | –7,2 |
| Seafood products | 122,0 | 7,7 | 15,5 | –15,8 |
| Industrial raw materials | 91,4 | 5,4 | 1,2 | 9,1 |
| Agricultural raw materials | 133,3 | 9,2 | 13,1 | 19,0 |
| Natural Fibres | 111,5 | 8,0 | 12,0 | 8,4 |
| Natural rubber | 48,2 | 8,0 | 2,7 | –12,2 |
| Hides | 77,2 | –0,2 | –3,3 | –16,2 |
| Wood pulp | 139,0 | 7,4 | 13,5 | 25,8 |
| Tropical wood | 97,0 | –0,5 | 0,7 | –2,4 |
| Sawn softwood | 275,9 | 18,1 | 25,3 | 50,8 |
| Minerals | 83,8 | 4,5 | –1,3 | 7,0 |
| Ferrous metals | 53,0 | 4,8 | –9,9 | –0,2 |
| Non-ferrous metals | 112,0 | 4,6 | 4,6 | 14,1 |
| Precious metals | 106,6 | 2,1 | 2,2 | –3,2 |
| All commodities | 104,9 | 5,5 | 4,7 | –0,3 |
- Source: INSEE
graphiqueGraph1 – Oil (Brent)

- Source : INSEE
graphiqueGraph3 – Food

- Source : INSEE
graphiqueGraph2 – Imported raw materials (excluding energy)
- Source : INSEE
graphiqueGraph4 – Industrial raw materials
- Source : INSEE
Pour en savoir plus
Time series : Raw materials prices
