


 30 May 2018
2018- n° 138Household consumption expenditure on goods declined sharply in April 2018 (−1.5%) Household consumption expenditure on goods - April 2018
30 May 2018
2018- n° 138Household consumption expenditure on goods declined sharply in April 2018 (−1.5%) Household consumption expenditure on goods - April 2018
In April 2018, household expenditure on goods declined strongly (−1.5%) in volume*. Energy consumption fell sharply, as did food purchases. On the contrary, expenses on textile-clothing were on the rise.
In April 2018, household expenditure on goods declined strongly (−1.5%) in volume*. Energy consumption fell sharply, as did food purchases. On the contrary, expenses on textile-clothing were on the rise.

*Volumes are measured at chain-link previous year prices (2014 euro billions) and all figures are trading-day and seasonally adjusted.
graphiqueGraph1 – Total consumption of goods

- Source: INSEE
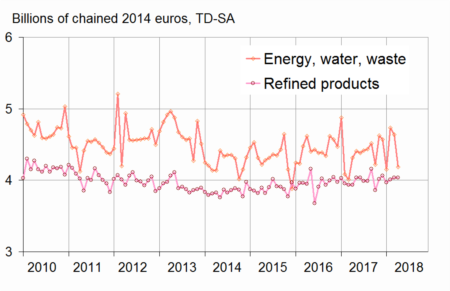
Energy: sharp decline
In April, energy consumption fell again (−5.4% after −0.9%). Heating expenses dropped significantly due to well above seasonal norm temperatures in April, after the cold months of February and March. On the other hand, consumption of refined products was virtually stable (+0.1%): spending on diesel fuel declined while spending on gasoline increased.
graphiqueGraph2 – Breakdown of energy
- Source: INSEE
Food products: clear decrease
In April, food consumption decreased sharply (−1.8%), after rising for two months (+0.2% in March and +1.3% in February). Purchases were lower both in unprocessed agricultural goods (fruits, vegetables) and in agrifood products (meat, dairy products) and beverages.
On the contrary, tobacco consumption recovered very slightly in April, after the previous month drop that followed the price increase on 1st March 2018.
graphiqueGraph4 – Food products, engineered goods and energy

- Source: INSEE
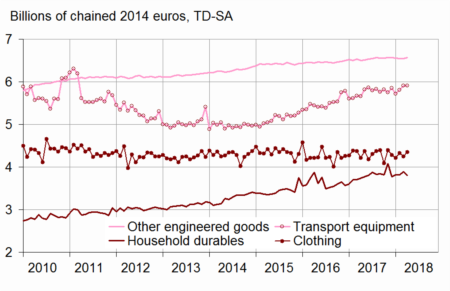
Engineered goods: moderate growth
In April, expenditures on manufactured goods slowed down (+0.2% after +0.5% in March). The slight growth was driven by the dynamism of clothing purchases, which offset the decline in the consumption of durables.
graphiqueGraph3 – Breakdown of engineered goods
- Source: INSEE
Durables: declining
Consumption of durables fell (−0.7%) in April, after a two-month increase. Purchases of houshold durables were down (−1.8%), in particular those of furniture and communication equipment (smartphones). Expenses on transport equipment were almost stable (+0.1%): the downturn in the second-hand vehicle market was offset by an upturn in new vehicle purchases.
Textile-clothing: steep rise
After a sharp drop in March, expenditure on textile-clothing rebounded steeply in April (+2.5% after −1.7%). This recovery was driven by purchases of clothing and shoes.
Other engineered goods: slight rebound
Purchases of “other engineered goods” increased slightly in April (+0.4%), after levelling off in March. In particular, consumption of DIY and hardware items was on the rise.
The variation in March 2018 is revised upwards
Compared to the previous estimation, the change of household expenditure on goods in March 2018 was revised upwards: +0.2% instead of +0.1%. Indeed, new information has been integrated and the seasonal adjustment coefficients have been updated.
tableauTable – Household consumption expenditure on goods
| Weight (1) | Feb. 2018 | Mar. 2018 | Apr. 2018 | Apr. 18 / Apr. 17 | Q / Q-1 | |
|---|---|---|---|---|---|---|
| Food products | 38 | 1.3 | 0.2 | –1.8 | –2.2 | 0.0 |
| - excl. Tobacco | 34 | 1.3 | 1.4 | –2.0 | –1.2 | 0.6 |
| Engineered goods | 45 | 0.8 | 0.5 | 0.2 | 2.5 | 0.2 |
| - Durables | 22 | 0.7 | 1.7 | –0.7 | 3.0 | 0.4 |
| Including : | 0.0 | 0.0 | 0.0 | 0.0 | 0.0 | |
| - Transport equipment | 12 | 1.6 | 1.8 | 0.1 | 4.5 | 1.7 |
| - Household durables | 7 | –0.2 | 1.8 | –1.8 | 1.8 | –1.4 |
| - Textile-clothing | 9 | 2.7 | –1.7 | 2.5 | 3.3 | 0.3 |
| - Other engineered goods | 14 | –0.2 | 0.0 | 0.4 | 1.1 | –0.2 |
| Energy | 18 | 8.1 | –0.9 | –5.4 | –0.4 | 1.0 |
| - Energy, water, waste | 10 | 14.1 | –2.0 | –9.8 | –3.0 | 1.6 |
| - Refined Products | 8 | 1.1 | 0.6 | 0.1 | 2.6 | 0.3 |
| Total | 100 | 2.3 | 0.2 | –1.5 | 0.2 | 0.2 |
| - Including Manuf. goods | 84 | 1.0 | 0.4 | –0.5 | 0.8 | 0.1 |
- (1) Weighting in the consumption expenditure on goods in value in 2017
- (2) Last three months / previous three months
Documentation
Methodology (pdf,23 Ko)
Pour en savoir plus
