


 24 May 2018
2018- n° 136In April, oil price ramped up strongly Prices of oil and raw material imports - April 2018
24 May 2018
2018- n° 136In April, oil price ramped up strongly Prices of oil and raw material imports - April 2018
In April 2018, the price of crude oil in euros ramped up strongly (+9.8% after +1.4% in March). The prices in euros of all other imported commodities bounced back lightly (+0.3% after −1.4 %): the prices of industrial raw materials stopped their decrease (+0.6% after −4.5%) while the prices of raw food materials were virtually stable (+0.1% after +2.1%).
In April 2018, the price of crude oil in euros ramped up strongly (+9.8% after +1.4% in March). The prices in euros of all other imported commodities bounced back lightly (+0.3% after −1.4 %): the prices of industrial raw materials stopped their decrease (+0.6% after −4.5%) while the prices of raw food materials were virtually stable (+0.1% after +2.1%).
Oil price ramped up strongly
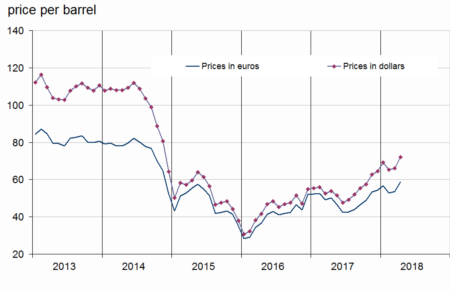
In April 2018, the price of North Sea crude oil (Brent) in euros increased slightly (+9.8% after +1.4% in February) to an average of €59 per barrel. In dollars, the decrease was less marked in March (+9.0% after +1.3% ).
tableauTable1 – Oil and petroleum products
| Prices | Change (%) | |||
|---|---|---|---|---|
| of last month | over the last month | over the last 3 months | over the last 12 months | |
| Brent in $ per barrel | 72,0 | 9,0 | 4,2 | 33,7 |
| Brent in € per barrel | 58,7 | 9,8 | 3,7 | 17,2 |
| Gasoline cts €/L | 43,1 | 9,9 | 4,5 | 8,6 |
| Gas Oil | 518,2 | 8,9 | 3,2 | 16,2 |
| Heavy fuel | 325,0 | 6,1 | 0,0 | 7,8 |
| Naphtha | 487,4 | 6,5 | 0,2 | 10,4 |
- Prices are in euros per tonne unless otherwise specified
- Source : INSEE
Industrial commodity prices picked up
In April 2018, the prices in euros of industrial raw materials rose moderatly (+0.6% after −4.5%). The prices of agro-industrial raw materials increased again (+2.2% after +1.3%), mainly because of sawn softwood (+5.6% after +0.5%) and wood pulp price (+3.0% after +2.6%). The price of tropical wood ramped up (+1.2%) after two months of virtual stability. The prices of natural fibres eased (+0.4 % after +3.2%). The price of hide decreased more clearly than in March (−2.8% after −0.5%), such as natural rubber price (−3.8% after −1.2%). The prices of minerals recovered slightly (+0.2% after −5.8%), largely due to non-ferrous metals (+4.5% after −4.4%). The prices of precious metals bounced back too (+1.0% after −0.9%). However, the prices of ferrous metals decreased again (−5.9% after −8.6%).
Food commodity prices were virtually stable
In euros, the prices of raw food materials were virtually stable (+0.1% after +2.1%). The prices of cereals ramped up (+3.5% after +2.7%). The prices of tropical foodstuffs eased (+2.3% after +3.2%), as those of seafood products (+1.2% after +5.8%). The prices of oil seeds and vegetable oils decreased again (−0.4% after −0.6%), those of meats retreated (−3.5% after +0.5%). The price of sugar decreased strongly again for the fifth month in a row (−7.6% after −5.2% in March), after the end of sugar quotas in Europe.
tableauTable2 – Imported raw materials (excluding energy) in euros
| Index | Changes (%) | |||
|---|---|---|---|---|
| of last month | over the last month | over the last 3 months | over the last 12 months | |
| Food total | 114,9 | 0,1 | 3,6 | –13,9 |
| Tropical foodstuffs | 98,4 | 2,3 | 8,5 | –11,5 |
| Oil seeds, vegetable oils | 108,9 | –0,4 | 1,6 | –7,6 |
| Cereals | 97,9 | 3,5 | 5,6 | 0,3 |
| Sugar | 57,3 | –7,6 | –16,3 | –36,9 |
| Meat | 134,7 | –3,5 | 2,5 | –11,7 |
| Seafood products | 113,3 | 1,2 | 3,9 | –22,6 |
| Industrial raw materials | 86,8 | 0,6 | –4,4 | –4,3 |
| Agricultural raw materials | 122,1 | 2,2 | 5,1 | 3,4 |
| Natural Fibres | 103,2 | 0,4 | 2,9 | –0,5 |
| Natural rubber | 44,6 | –3,8 | –9,0 | –27,3 |
| Hides | 77,3 | –2,8 | –4,2 | –25,4 |
| Wood pulp | 129,4 | 3,0 | 8,1 | 15,9 |
| Tropical wood | 97,5 | 1,2 | 1,4 | –2,7 |
| Sawn softwood | 233,7 | 5,6 | 10,9 | 18,4 |
| Minerals | 80,2 | 0,2 | –6,4 | –5,9 |
| Ferrous metals | 50,6 | –5,9 | –13,9 | –17,8 |
| Non-ferrous metals | 107,1 | 4,5 | –1,4 | 4,2 |
| Precious metals | 104,4 | 1,0 | –2,3 | –11,4 |
| All commodities | 99,3 | 0,3 | –0,6 | –9,3 |
- Source : INSEE
graphiqueGraph1 – Oil (Brent)
- Source : INSEE
graphiqueGraph3 – Food
- Source : INSEE
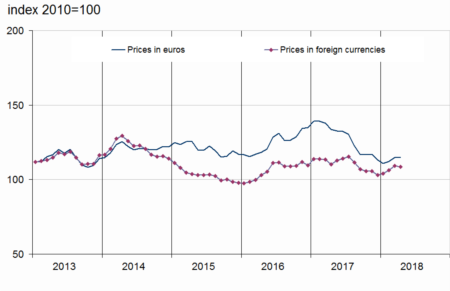
graphiqueGraph2 – Imported raw materials (excluding energy)

- Source : INSEE
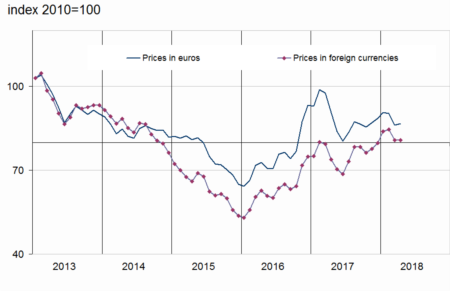
graphiqueGraph4 – Industrial raw materials
- Source : INSEE
Pour en savoir plus
Time series : Raw materials prices
